. 2014 Mar 25;3:e01948. doi: 10.7554/eLife.01948

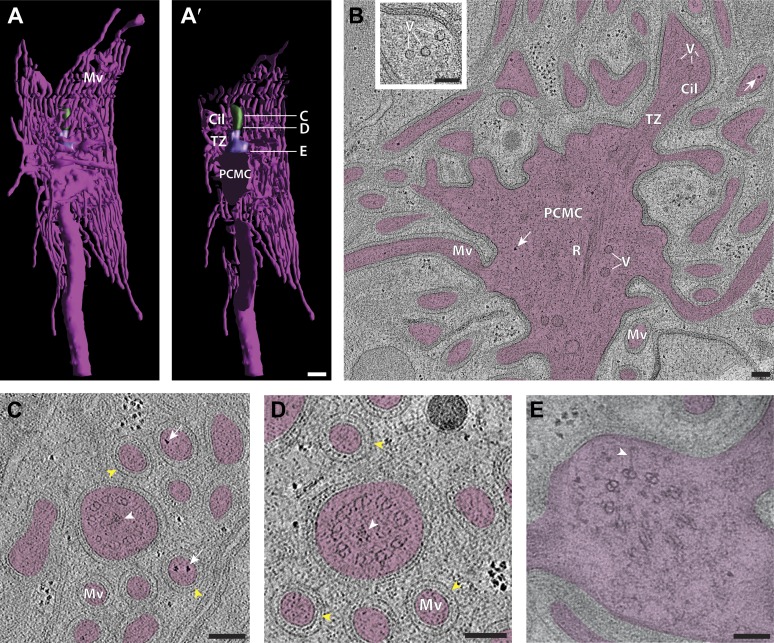
Figure 12. Ultrastructure of the sensory endings of AFD.

(A and A′) 3D reconstruction model of an AFD finger cell sensory ending with microvilli branches (magenta) and cilium (green). (A′) Clipped view allowing visualization of the TZ (purple) and PCMC. Scale bar: 500 nm. (B) Longitudinal ET slice of the AFD sensory ending indicating cilium (Cil), TZ, PCMC, and microvilli (Mv). Vesicles (V) and rootlet-like structures (R) are also marked. Ribosome-like structures are indicated by arrows. (C and D) Cross-sectional ET slice of AFD cilium distal-middle segment (C) and proximal-middle segment (D). Ribosome-like structures are indicated by white arrows; electron-dense rootlet-like material is indicated by white arrowheads; rings of regularly arranged particles of unknown composition between the AMsh and AFD cell membranes are visible (yellow arrowheads). (E) Cross-section TEM of the AFD TZ indicating long Y-links (white arrowhead). Scale bars: 100 nm. Figure 12—figure supplement 1 shows additional views of AFD morphology and ultrastructure. Figure12—figure supplement 2 shows interaction between the PCMCs of AFD and ASE.

DOI: http://dx.doi.org/10.7554/eLife.01948.026

Figure 12.

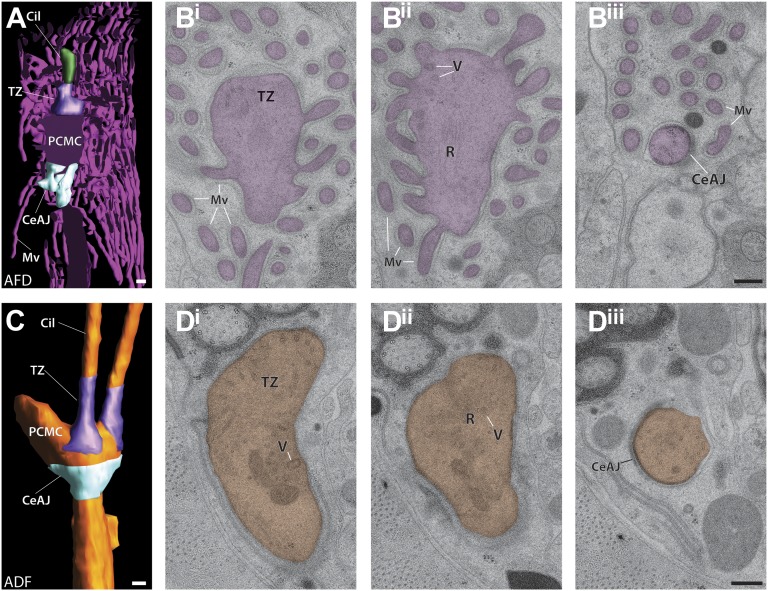
Figure 12—figure supplement 1. Periciliary membrane compartments.

Figure 12—figure supplement 1.

(A) Clipped view of a 3D reconstruction model of AFD and its PCMC, TZ (purple) and the CeAJ (light blue). Scale bar: 200 nm. (Bi–iii) ssTEM images of the (Bi) TZ/apical region of the PCMC, (Bii) middle plane with vesicles (V), and rootlet-like structures (R), and the CeAJ between the AFD cilium and sheath cell process (Biii). Note that microvilli (Mv) branch from the PCMC. Scale bar: 100 nm. (C) 3D reconstruction of the ADF PCMC indicating its boundaries: TZ (purple) and the CeAJ (light blue). Scale bar: 200 nm. (Di–iii) ssTEM images of the apical part of the ADF PCMC with the basal portion of the TZ and vesicles (Di), middle PCMC plane with vesicles, unorganized MTs and rootlet-like structure (Dii), and (Diii) the CeAJ at the PCMC base. Scale bar: 100 nm.
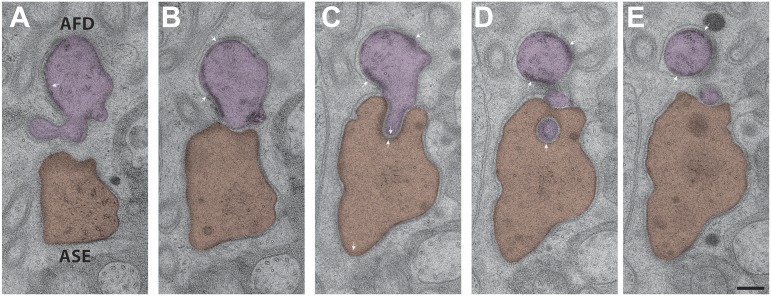
Figure 12—figure supplement 2. Interactions between the PCMCs of AFD and ASE.

Figure 12—figure supplement 2.

The AFD PCMC has a stereotypical projection into the ASE PCMC. Both of these PCMC regions are bound by CeAJs (arrowheads) between the cilium and the sheath cell process. Sections are from distal (A) to proximal (E). Scale bar: 200 nm.