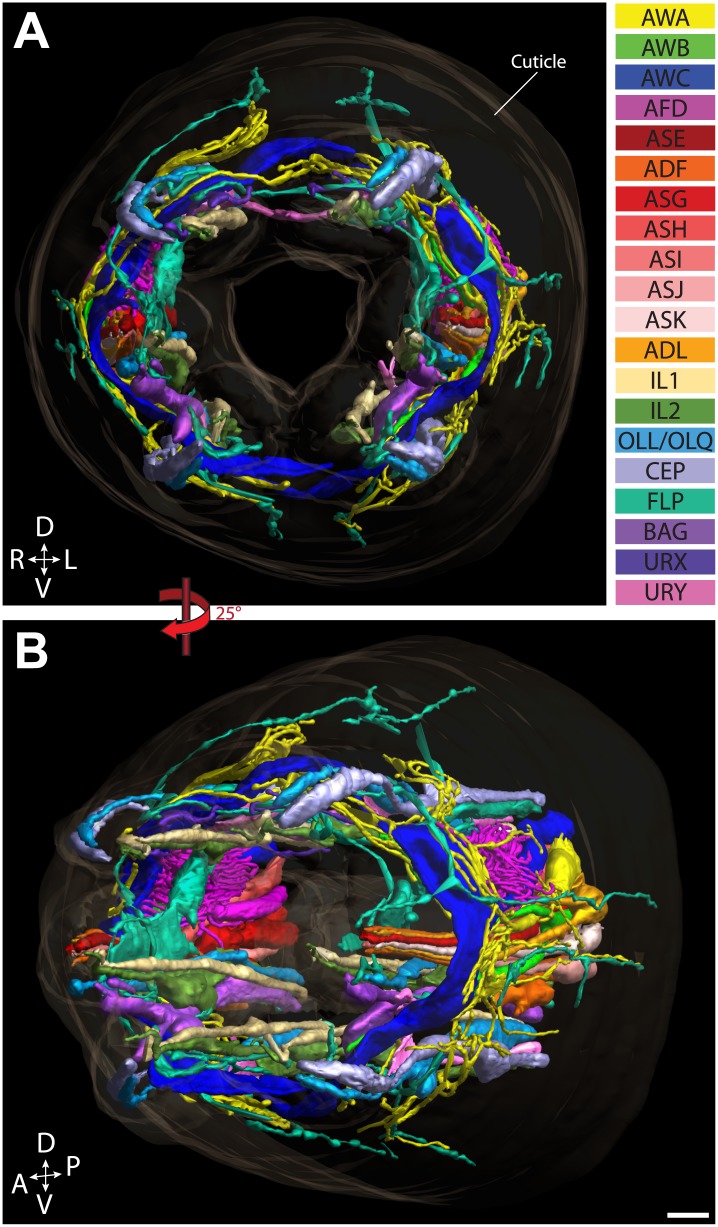
Figure 2. Graphical model of a high-resolution ssTEM 3D reconstruction of the anterior sensory endings.
3D reconstruction of the cilia and dendritic endings of anterior sensory neurons modeled from 166 thin serial sections (14 µm, starting at the nose). Front (A) and angled (B) profile views are shown. Cell projections are color-coded as indicated in upper right panel. D, dorsal; V, ventral; A, anterior; P, posterior. Scale bar: 1 µm.

