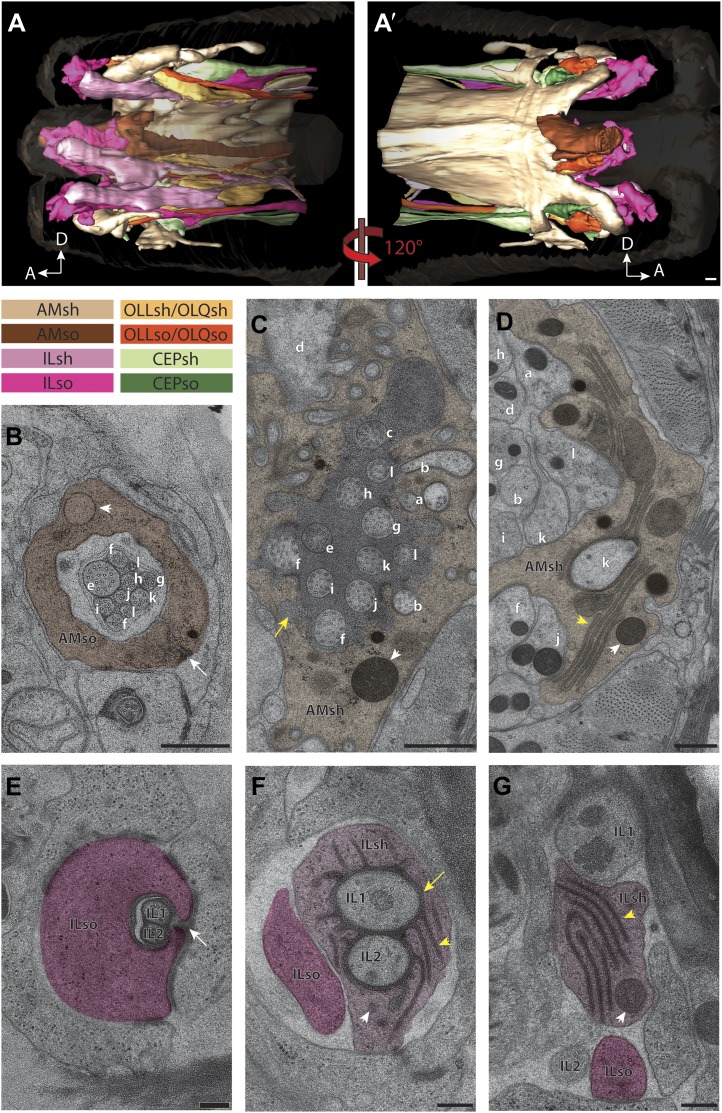
Figure 3. Two glial cell types are associated with each ciliated sensillum.
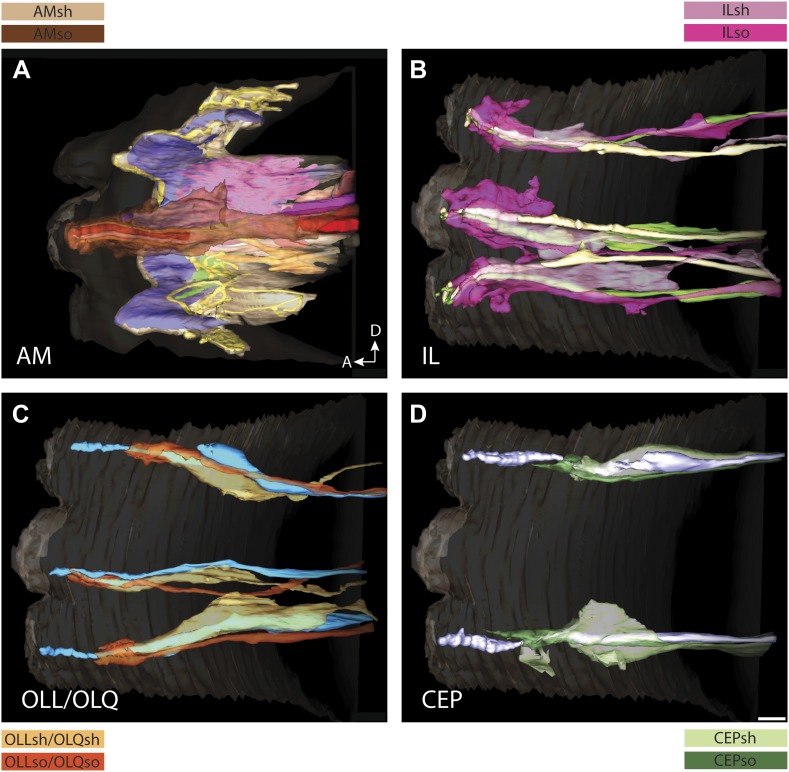
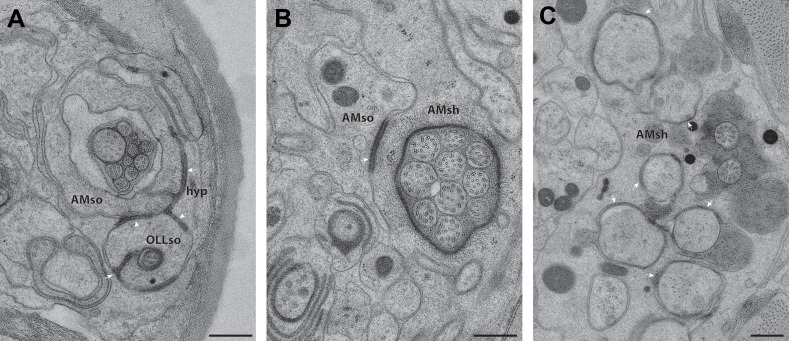
(A and A′) 3D reconstruction models of sheath (sh) and socket (so) glia for left side of the worm for amphid (AM), inner labial (IL), outer labial (OLL/OLQ), and cephalic (CEP) glia. Glial types are color coded as indicated. See Figure 3—figure supplement 1 for 3D models of glia associated with individual anterior sensilla. (B–D) Distal (B), middle (C) and region proximal to the amphid cilia TZ (D). Channel cilia of individual neurons are labeled with the last letter in their names. Arrow indicates the autocellular junction; arrowhead indicates vesicle present in the AMso process. (C) The AMsh glial cell process surrounds the proximal regions of amphid neuron cilia; the lumen contains electron-dense matrix (yellow arrow). White arrowhead indicates vesicle in the AMsh process. (D) The AMsh process contains extensive Golgi lamellae (yellow arrowhead) and secretory vesicles (white arrowhead). Cilia are labeled as above. (E–G) Distal (E), middle (F), and region proximal to the TZs (G) of the IL neurons. Autocellular junction in the ILso process is indicated by an arrow in (E). The lumen of the ILsh glial cell process surrounding the IL1/IL2 proximal cilia region also contains electron-dense matrix (yellow arrow in F), and a network of ER/Golgi (yellow arrowheads in F and G). Vesicles are indicated by white arrowheads. Scale bars: (A–D) 500 nm; (E–G) 200 nm. Figure 3—figure supplement 2 shows additional examples of CeAJs among glial and neuronal cells in individual sensilla.


