. 2014 Mar 25;3:e01948. doi: 10.7554/eLife.01948

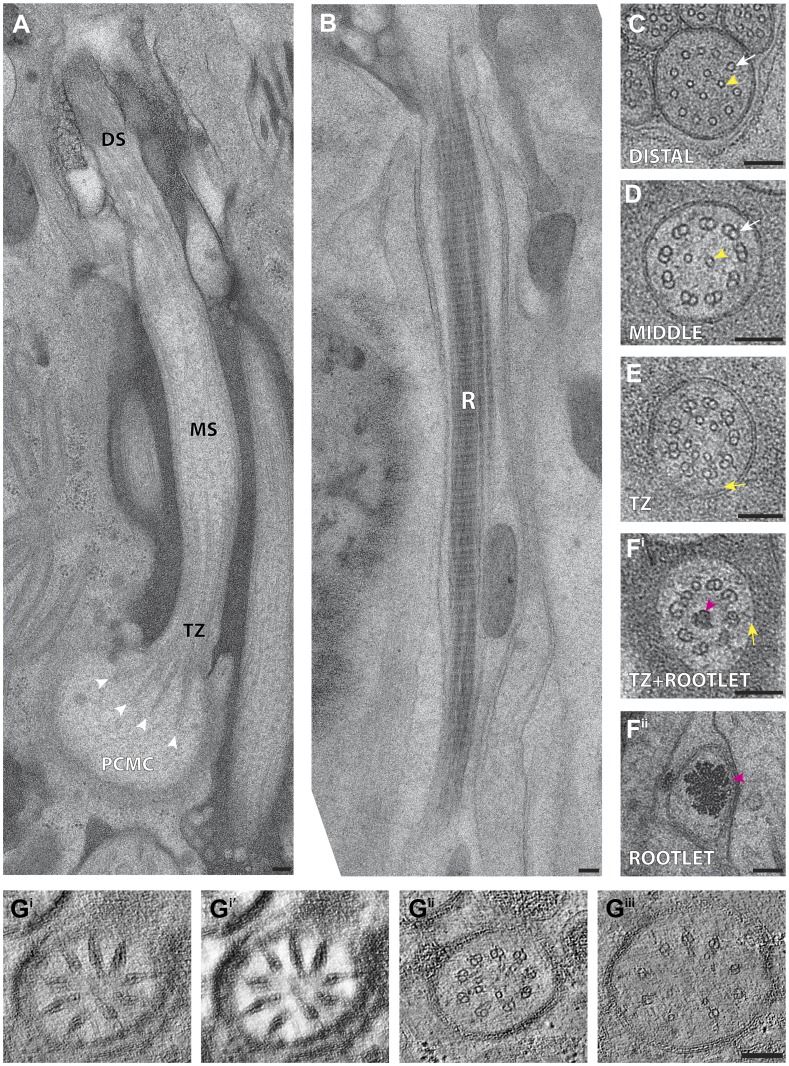
Figure 4. C. elegans ciliary ultrastructure.

(A) Longitudinal section of an amphid channel cilium (ASE), showing distal segment (DS), middle segment (MS), TZ and PCMC. Flaring of the MTs at the ciliary base is indicated by arrowheads. (B) Longitudinal section of a long striated rootlet (R) within the dendrite of an IL1 neuron. Cross-section TEMs of (C) distal segment (ASE cilium), (D) middle segment (ASI cilium), and (E) TZ (ASI cilium). (Fi) Cross-section TEM of the rootlet-like material within the IL1 TZ, and (Fii) the rootlet within the IL1 dendrite. White arrows indicate outer sMTs (C) or dMTs (D). Yellow arrows indicate Y-links. Yellow and pink arrowheads indicate isMTs and rootlet, respectively. (Gi–iii) ssET of flared dMTs in cross-section at the TZ of ASI cilium. (Gi) Binned serial section tomogram (140 slices) and (Gi′) filtered image simulating a thick plastic section of the proximal ASI TZ. Serial section tomogram (10 slices binned) of the (Gii) distal and (Giii) proximal part of the same TZ region as in (Gi) shows distinct dMTs and isMTs. Scale bars: 100 nm. See Figure 4—figure supplement 1 for additional views of MTs, apical rings and rootlet-like structures, and Figure 4—figure supplement 2 for further ET analyses of the flared dMTs at the ciliary base.

DOI: http://dx.doi.org/10.7554/eLife.01948.011

Figure 4.

Figure 4—figure supplement 1. Subcellular features of amphid cilia.

Figure 4—figure supplement 1.

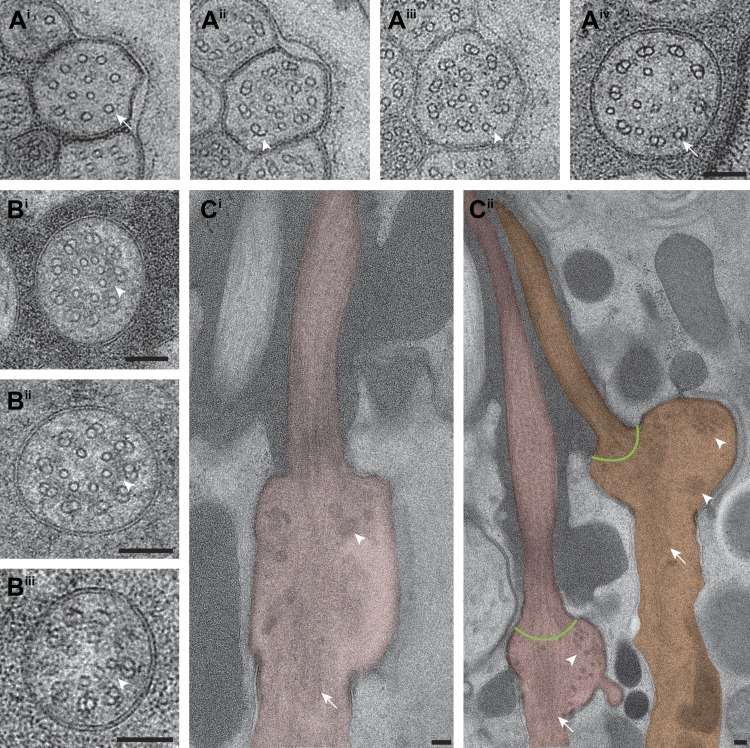
(Ai–iv) Cross-section TEM series of an ASE cilium showing doublet-to-singlet MT transition from distal (Ai) to proximal (Aiv). B-tubule hooks are indicated by arrowheads; dsMTs and sMTs are indicated by arrows. (Bi–iii) ssTEM images showing different amphid channel cilium TZs (Bi—AWC; Bii—ADF; Biii—ASI); apical rings are indicated by arrowheads. (Ci–ii) Longitudinal-section TEM images of the base of amphid channel cilia (Ci) ASJ and (Cii) ASI (left) and ADF (right; only one cilium shown), showing vesicles (arrowheads) and rootlet-like structures (arrows). Green lines at the proximal ends of dMTs represent possible localization site of proteins thought to be localized to transition fibers in C. elegans. Scale bar: 100 nm.
Figure 4—figure supplement 2. ET analyses of flared dMTs at the ciliary base.

Figure 4—figure supplement 2.

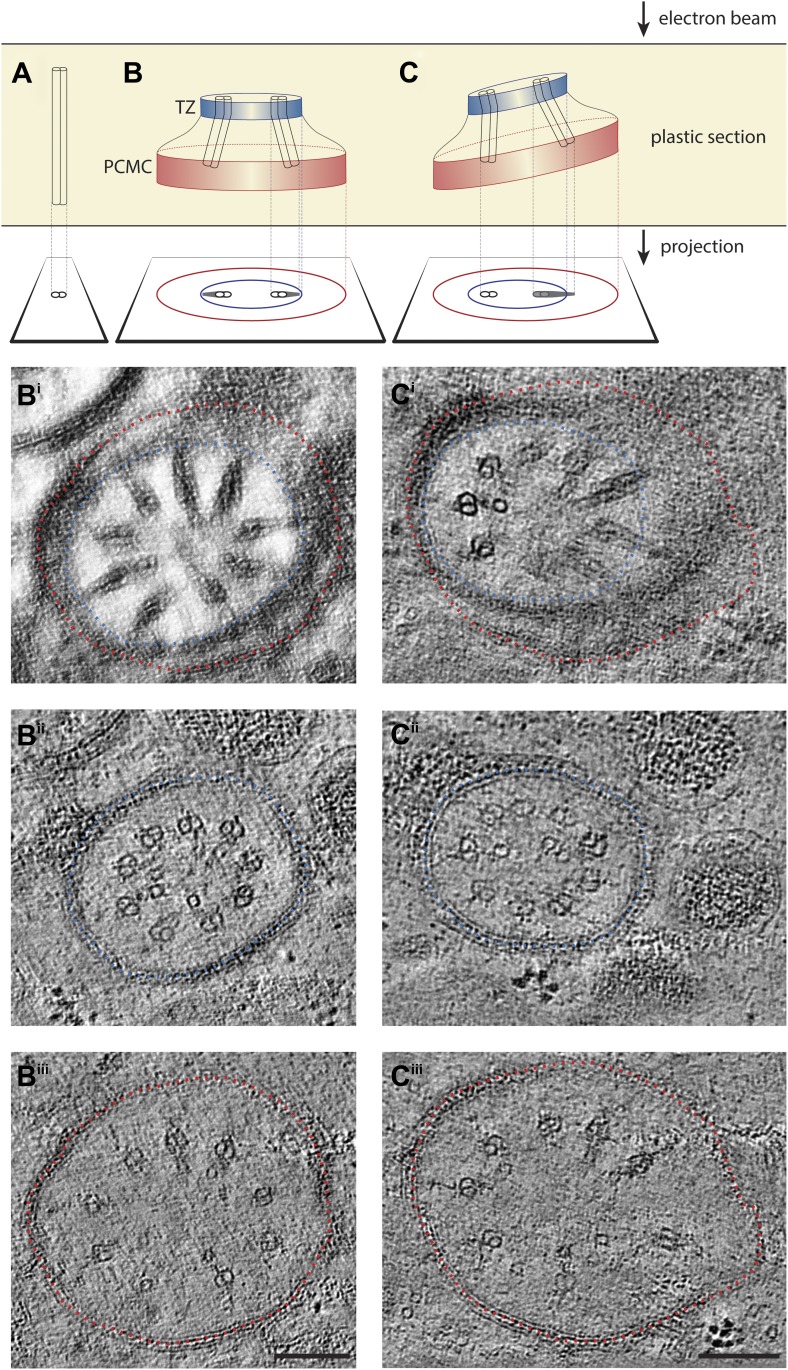
(AC) Diagrammatic representations of 2D TEM projections of ciliary structures through plastic sections and images of corresponding ET slices below. Only one or two dMTs are represented in the diagrams for simplicity. (A) A dMT in perfect cross-sectional orientation. (B) A 2D projection TEM image of a plastic section with the cilium base in cross-sectional orientation would show the proximal flared dMTs as wedge-shaped electron-dense structures. This 2D projection image also often displays both a smaller diameter membrane from the TZ (blue circle) and a larger diameter membrane from the PCMC (red circle). In such projections (diagrammatic in B, and the simulated projection image Bi corresponding to Figure 4Gi′ through a ∼140-nm thick serial section electron tomogram), the flared dMTs appear to radiate outwards contacting the inner membrane (blue). However, our 3D ssET data clearly reveal that this is due to the 2D projection, since the inner membrane (blue) corresponds to the membrane in the TZ region, whereas the peripheral tips of the wedge-shaped dMT projections correspond with the PCMC region (membrane indicated in red) and are in reality distant from the PCMC membrane in 3D. This can be observed more clearly in the distal and proximal 10-nm thick ET slices (Bii and Biii, corresponding to Figure 4Gii,Giii) of the same ciliary base region shown in Bi. Note that the diameter of the axoneme in Biii is larger than that in Bii due to the dMT flaring. (C) A tilted 2D projection view shown diagrammatically (C) and simulated (Ci) displays both doublets (dMTs viewed in cross-section) and and wedge-shaped structures (dMTs viewed obliquely). Distal (Cii) and proximal (Ciii) ET slices of the same region shown in Ci further again clearly reveal dMTs that remain distant from the membrane and flare proximally (Ciii). Scale bar: 100 nm.