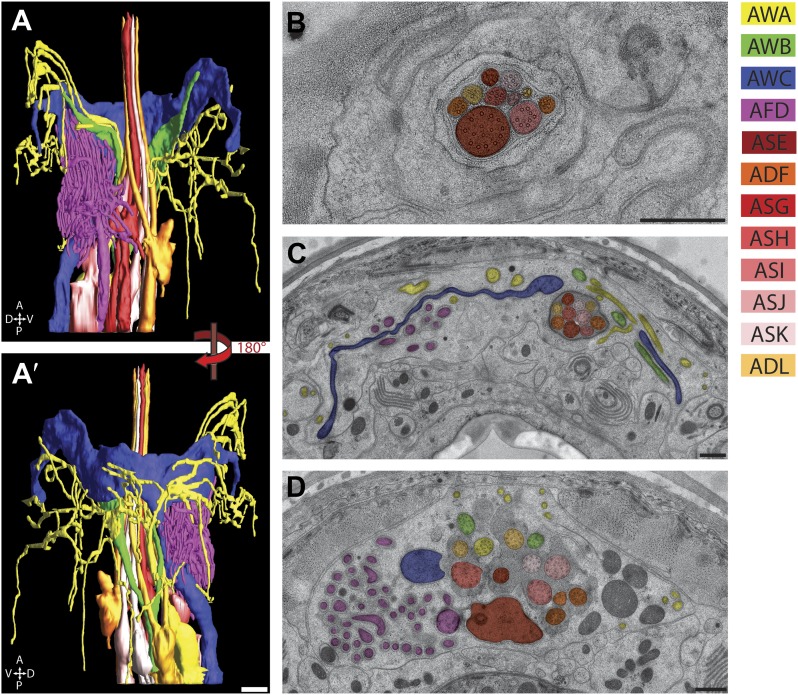
Figure 6. The amphid sensillum.
(A and A′) 3D graphical model of the reconstructed amphid sensilla on the right side indicating the endings of twelve sensory neurons. Scale bar: 1 µm. (B) Distal, (C) middle, and (D) proximal TEM cross-sections of an amphid sensillum. Endings of individual amphid neurons are color coded as indicated. Scale bars: 500 nm.

