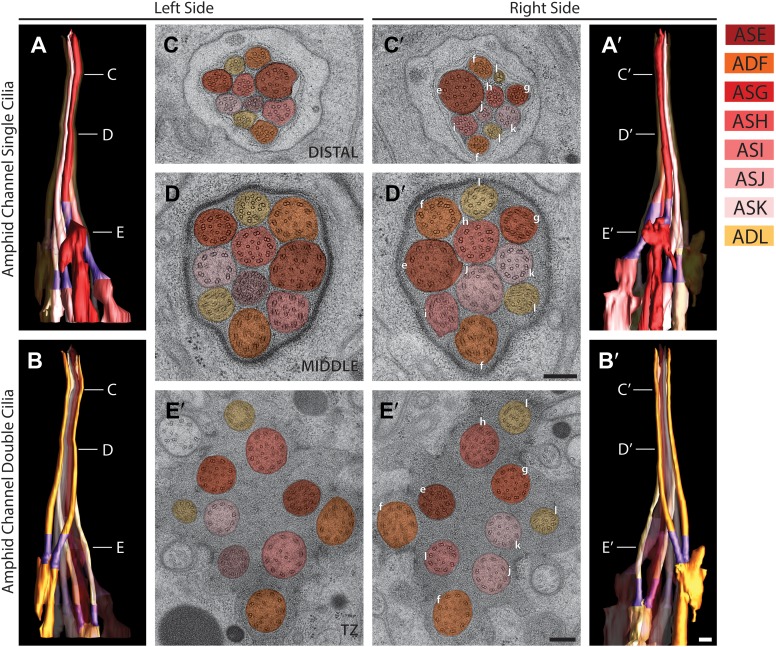
Figure 7. Morphology and ultrastructure of amphid channel cilia.
Reconstructed 3D models of amphid channel cilia containing single (A and A′) or double (B and B′) rods on the left (A and B) and right (A′ and B′) sides. Labels indicate approximate positions of cross-sections shown in C–E′. TZs (purple) are indicated. Scale bar: 500 nm. (C–E′) Cross-section TEM images of amphid channel at the level of distal segment (C and C′), middle segment (D and D′), and TZ (E and E′). Individual cilia are identified on the right only by the last letter in their names. Scale bars: 200 nm. See Figure 3—figure supplement 2C for additional views of the TZs and rootlet-like structures at the base of amphid neuron cilia.

