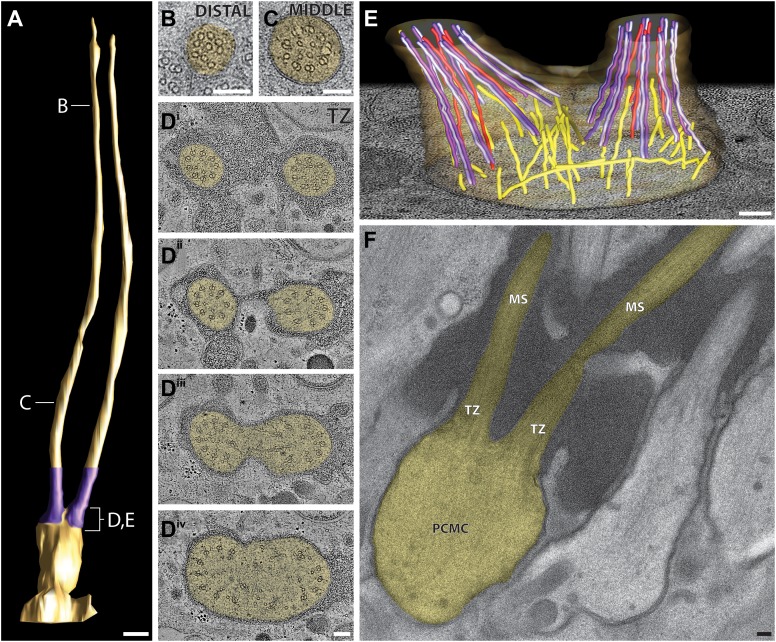
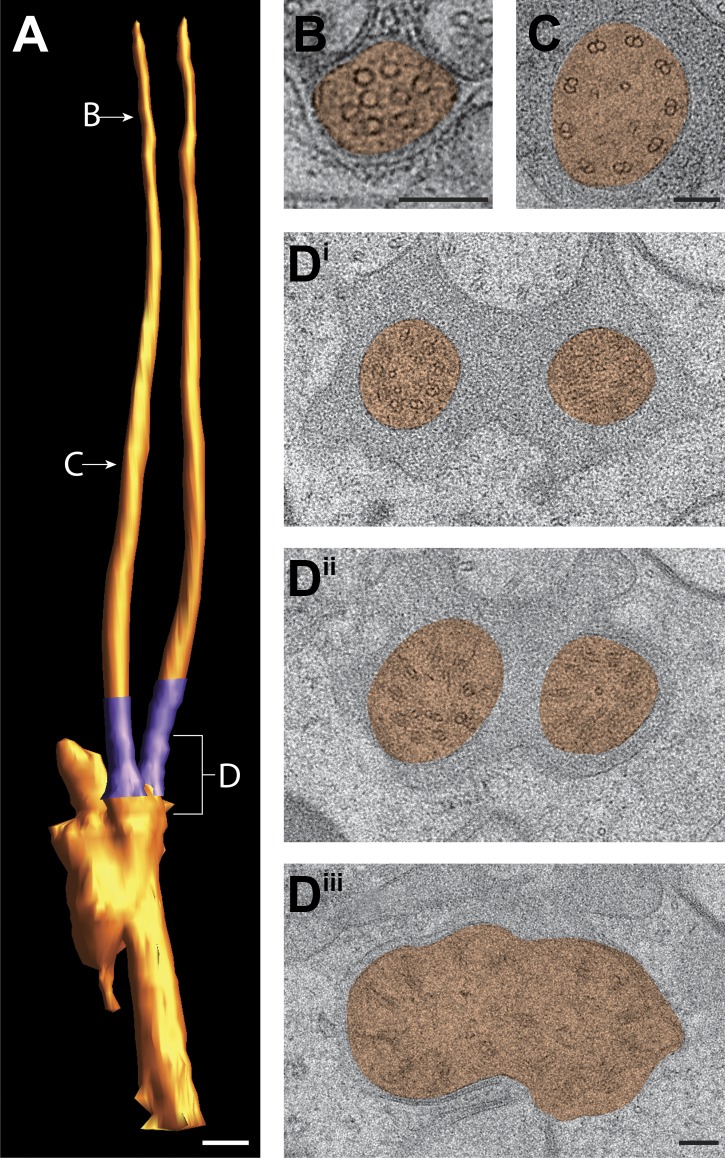
Figure 8. Ultrastructure of the ADL neuron cilia.
(A) 3D reconstruction model of the two ADL channel cilia, indicating TZs (purple) at the base of each cilium. Labels indicate approximate location of sections shown in B–E. Scale bar: 500 nm. (B and C) Cross-section TEM images of distal (B) and middle segments (C) of the two ADL cilia. (Di–iv) ssET images of the ADL TZs (distal to proximal). (E) 3D reconstruction model of the ADL TZ area (indicated in A). Color code: dark purple—A-tubules; light purple—B-tubules; red—isMTs; yellow—other MTs in the dendrite. The ADL cell membrane is modeled in brown/tan. (F) Longitudinal TEM section of ADL, indicating PCMC, TZs, and middle segment (MS). Scalebars: 100 nm. See Figure 8—figure supplement 1 for ultrastructure of ADF cilia.


