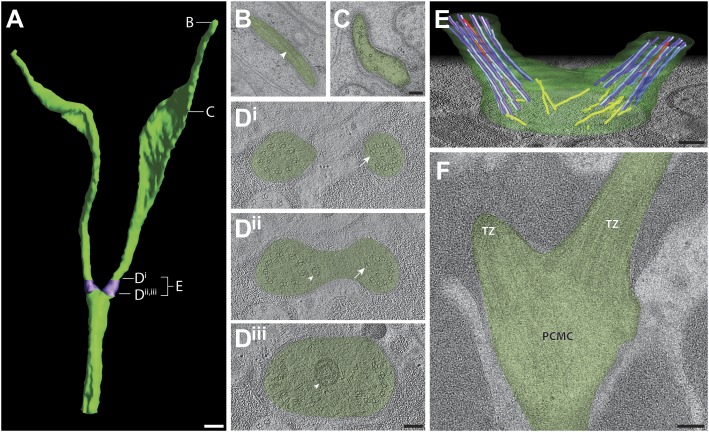
Figure 9. Ultrastructure of the AWB neuron cilia.
(A) 3D reconstruction model of AWB cilia, indicating TZs (purple). Labels indicate approximate location of sections and models shown in B–E. Scale bar: 500 nm. (B and C) Cross-section TEM images of far-distal (B) and distal segment (C) of the two AWB cilia. Arrowhead indicates a MT in B. (Di–iii) ssET images of the AWB TZs (distal to proximal). B-tubule hooks are indicated by arrows; vesicles are indicated by arrowheads. (E) 3D reconstruction model of the AWB TZ region. Color code: dark purple—A-tubules; light purple—B-tubules; red—isMTs; yellow—other MTs in the dendrite. The AWB cell membrane is modeled in green. (F) Longitudinal TEM section of AWB, indicating PCMC and TZs. Scale bars: 100 nm.

