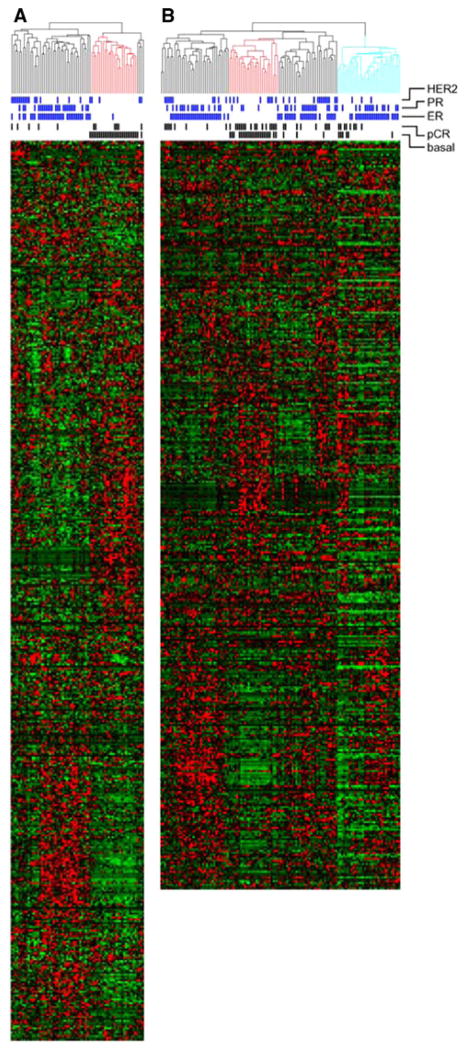
Fig. 1.
Identification of basal-like tumors. Unsupervised hierarchical clustering of samples from WU using the “intrinsic” signature (a) and Hess et al. (b) [4]. The red branch demarcates BL tumors. Blue marks denote positive expression of ER, PR,and HER2. Black marks denote pCR. Probe set numbers differ between the two plots as the result of oligonucleotide platforms. For the analyses, probe sets common to both chips were used. In the right-most branch of (b) (blue), samples had low values and were therefore excluded from the analysis

