
Fig. 3.
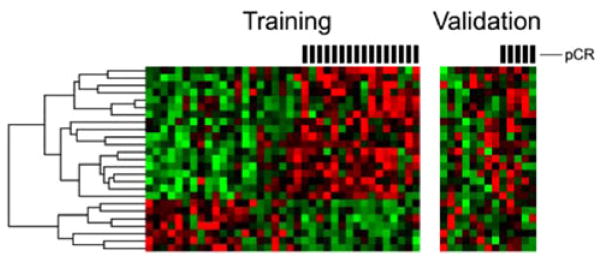
Training and validation heat plots of the 25 probe model. Using linear discrimination analysis, each of the 13 validation samples were compared to the training data and predicted to have had pCR or RD to neoadjuvant therapy. All RD samples were correctly categorized as such, as were five of six pCR samples. Overall accuracy was 92% (95% CI 64–100), with sensitivity of 80% (95% CI 28–99) and specificity of 100% (95% CI 63–100). Hash marks above heat plots mark samples which had pCR to neoadjuvant therapy