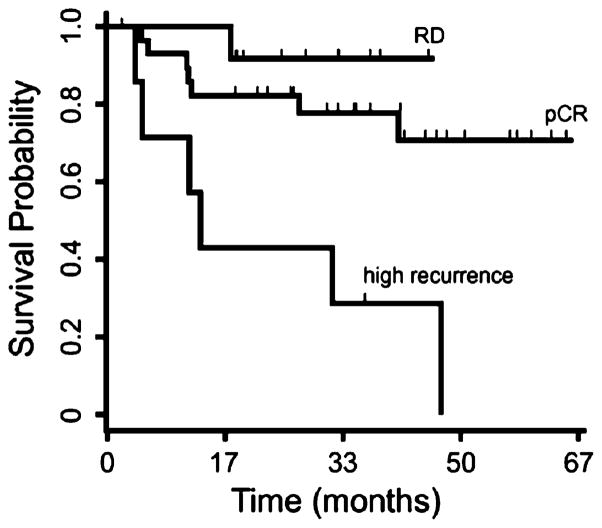
Fig. 5.
Kaplan–Meier survival analysis. Disease-free survival estimates for the three groups—pCR, RD, and high recurrence—resulting from hierarchical clustering of the 50 basal-like tumors with the 23-gene prediction profile demonstrated a statistically significant difference in survival between the pCR, RD and high recurrence groups (P<0.01). Survival analysis of the pCR and RD groups alone did not achieve statistical significance

