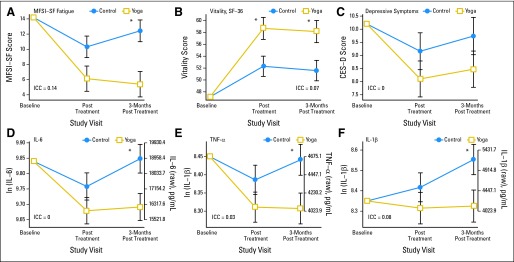
Fig 2.

Changes in (A) Multidimensional Fatigue Symptom Inventory–Short Form (MFSI-SF) fatigue scores, (B) vitality scores (36-item short form [SF-36]), (C) depressive symptoms (Center for Epidemiological Studies–Depression [CES-D]), and (D, E, F) lipopolysaccharide-stimulated cytokine production (interleukin-6 [IL-6], tumor necrosis factor alpha [TNF-α], and interleukin-1β [IL-1β]) immediately post treatment and 3 months post treatment in the yoga and control groups. Results shown are mean ± SE from mixed models adjusting for baseline levels. All models conditioned on baseline outcome levels as specified a priori in the trial protocol. ICC, intraclass correlation coefficient. (*) P < .05 for group comparison. ln, natural log.
