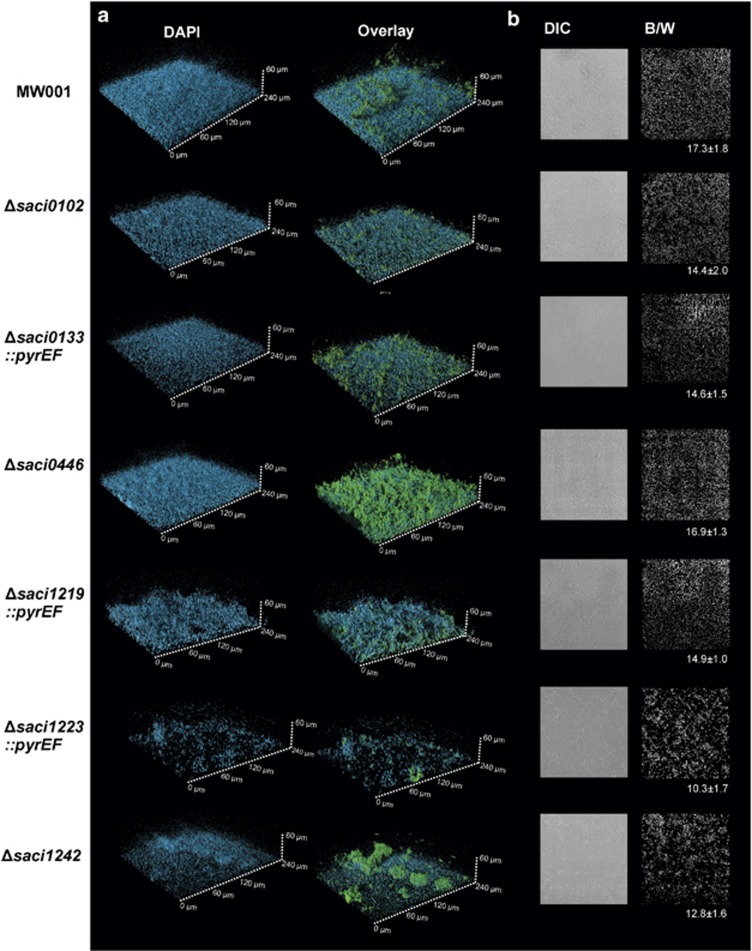
Figure 3.
CLSM analysis of biofilm formed by the S. acidocaldarius lrs14 deletion mutants. (a) Three-day-old biofilms were subjeted to CLSM. The blue channel is the 4′-6-diamidino-2-phenylindole (DAPI) staining. The green channel represents the fluorescently labeled lectin ConA that binds to glucose and mannose residues. The lectin IB4 able to bind to a-galactosyl residues is shown in yellow. Overlay images of all three channels are shown. (b) Differential interference contrast (DIC) pictures (left panel) were taken from the bottom layer of biofilms and converted into black/white (B/W; right panel) to calculate the surface coverage. Numbers represent the percentage of surface coverage for each mutant strain.

