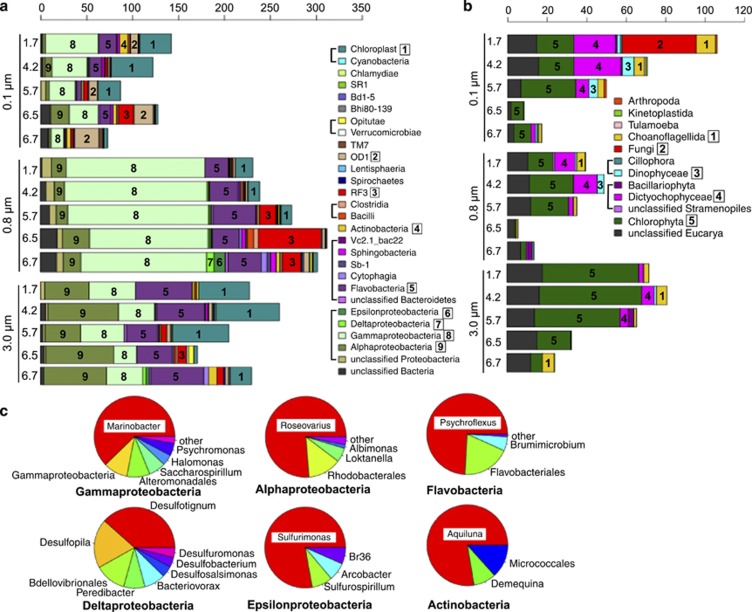
Figure 2.
Diversity of Bacteria and Eucarya in Organic Lake. (a) Bacteria and (b) Eucarya from each size fraction (0.1, 0.8 and 3.0 μm) at each sample depth (1.7, 4.2, 5.7, 6.5 and 6.7 m) aggregated according to class. The x-axis shows counts of SSU rRNA gene sequences normalized to average reads acquired per sample filter. Taxa that belong to the same higher rank are shown grouped with a square bracket in the legend. Abundant taxa are labeled in the plot with a number that corresponds to the numbered boxes in the legend. (c) Composition of abundant bacterial classes across all size fractions combined. See Supplementary Table S4 for lower taxonomic rank assignments.

