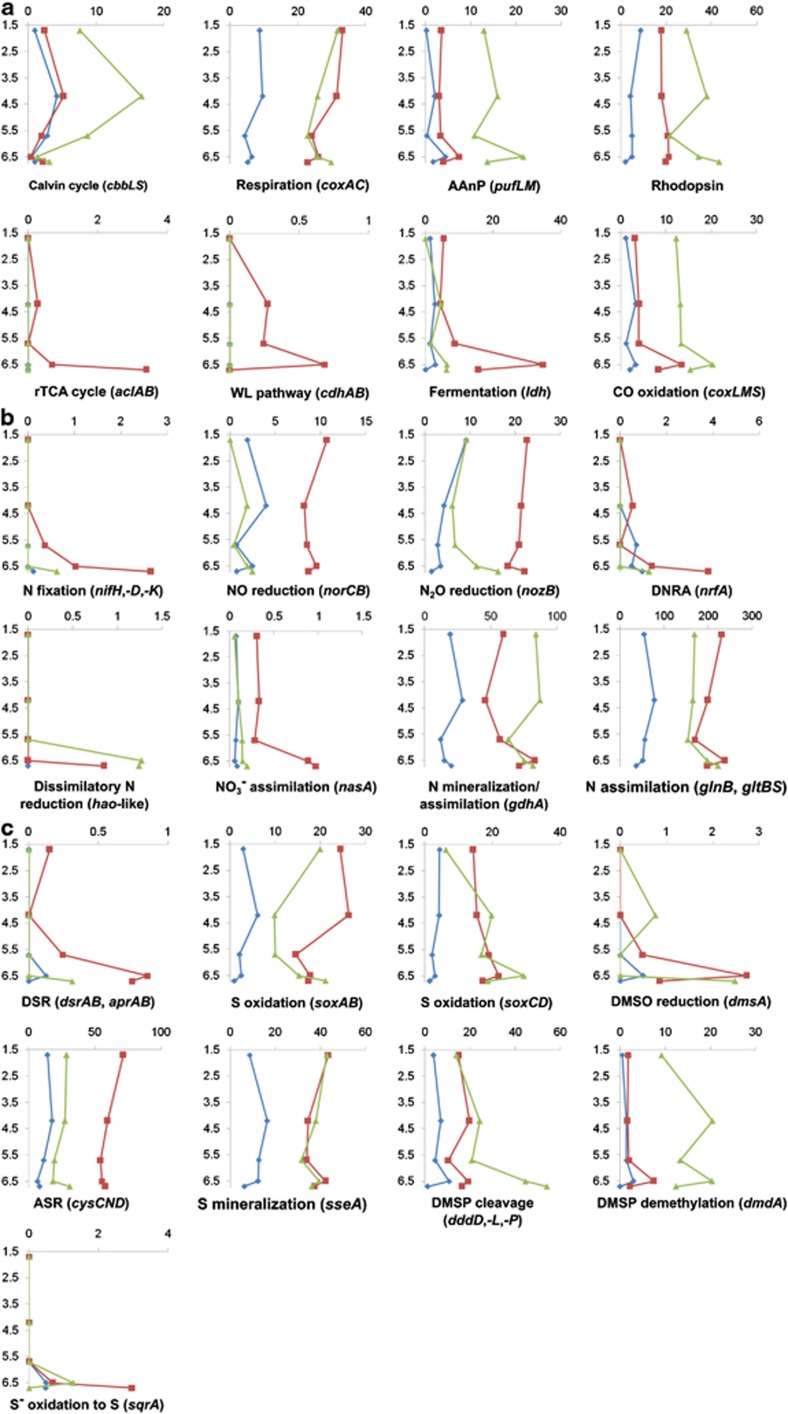
Figure 4.
Carbon, nitrogen and sulfur cycles in Organic Lake. Vertical profiles of genetic potential for (a) carbon (b) nitrogen and (c) sulfur conversions for each size fraction. The y-axis shows sample depths (m) and the x-axis shows counts of marker genes normalized to 100 Mbp of DNA sequence. The 0.1, 0.8 and 3.0 μm size fractions are shown as blue, red and green, respectively. Counts for marker genes for the same pathway or enzyme complex were averaged and those from different pathways were summed. For marker gene descriptions see Supplementary Tables S2 and S3. AAnP, aerobic anoxygenic photosynthesis; rTCA, reverse TCA; WL, Wood-Ljungdahl; DNRA, dissimilatory nitrate reduction to ammonia; DSR, dissimilatory sulfate reduction; DMSO, dimethylsulfoxide; ASR, assimilatory sulfate reduction; DMSP, dimethylsulfoniopropionate.

