Figure 3.
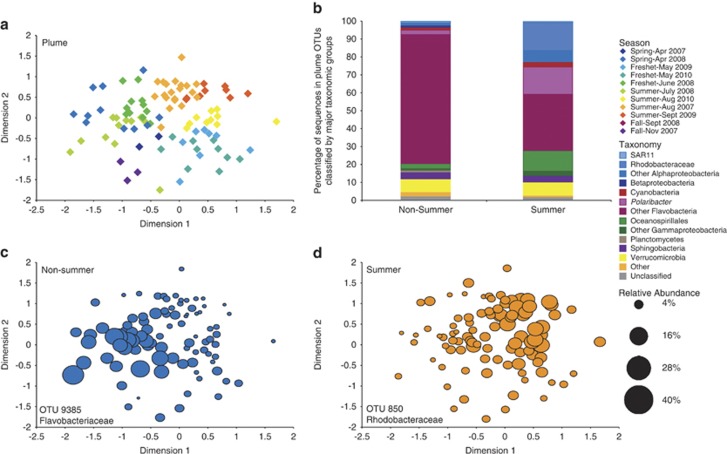
(a) Seasonal multidimensional scaling diagram of plume samples, produced with Bray-Curtis similarity values for communities that only included plume-specific OTUs (Stress=0.17). Samples separated into two significantly different communities, non-summer (April–July, November) and summer (August–September) (ANOSIM, P<0.001). (b) Taxonomy of the two seasonal groups. (c, d) Spatial distribution of the top indicator for non-summer (IV: 0.76) and summer (IV: 0.67), by average relative abundance, across the ordination of the plume MDS.

