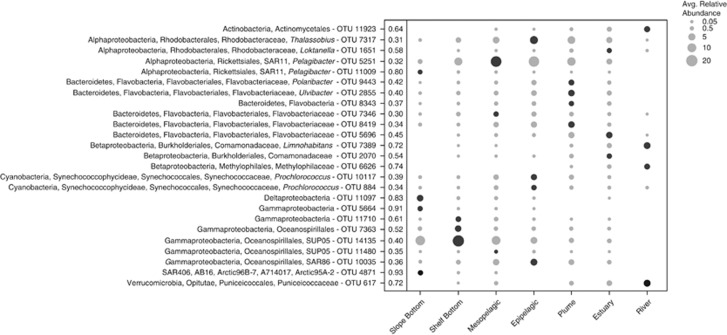
Figure 5.
Bubble plot of top indicator OTUs in each environment. The size of the bubble indicates the average relative abundance (%) of each OTU in each of the seven environments. Black shaded bubbles show the environment for which each OTU is an indicator. Indicator values are displayed next to each OTU.

