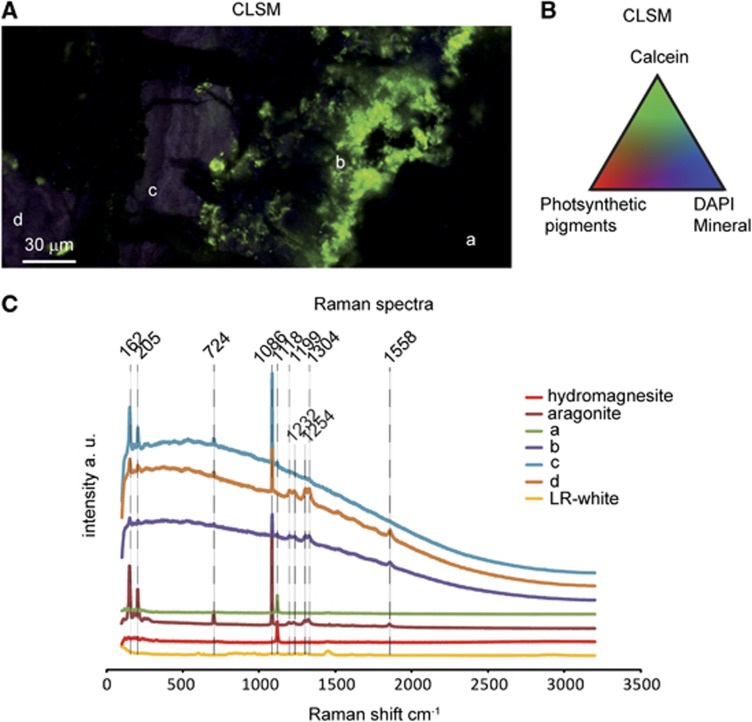
Figure 3.
(A) CLSM image of LR-white-embedded, calcein- and DAPI-stained microbialite from 10 cm water depth in the lake. The image was obtained by a concomitant excitation at 405, 488 and 543 nm. (B) Pseudocolors associated with the components of the image determined by their fluorescence spectra. (C) Raw Raman spectra associated with the different areas shown in A and references spectra for aragonite, hydromagnesite and LR-white. Background in b, c and d is inherent to the strong fluorescence emitted by the sample.

