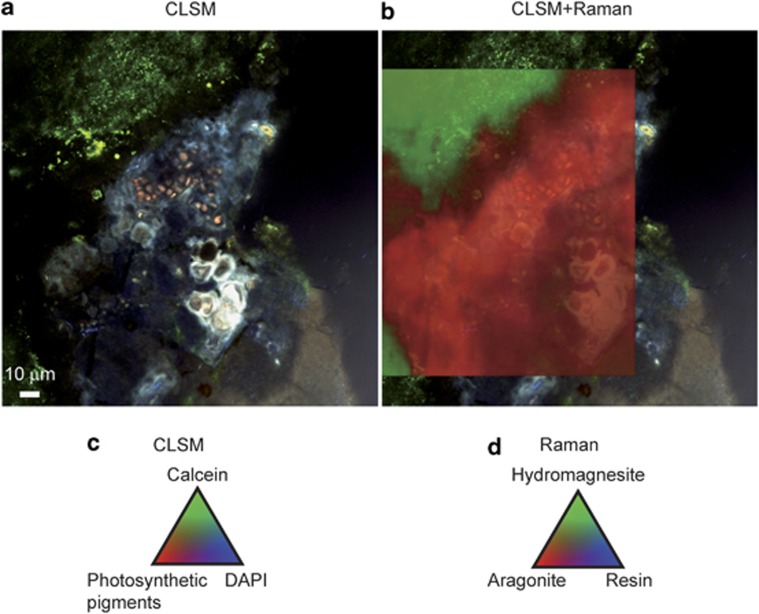
Figure 6.
(a) CLSM image of LR-white-embedded, calcein- and DAPI-stained microbialite from 14 m water depth obtained by a concomitant excitation at 405, 488 and 543 nm. (b) Superimposed composite tricolor Raman map displaying the spatial distribution of aragonite, hydromagnesite and LR-white resin, and showing that the aragonite distribution correlates with the patterns of the Pleurocapsales colony. (c) Pseudocolors associated to the components of the CLSM image and identified by their fluorescence spectra. (d) Pseudocolors associated to the components of the Raman map as determined by their characteristic Raman spectra.

