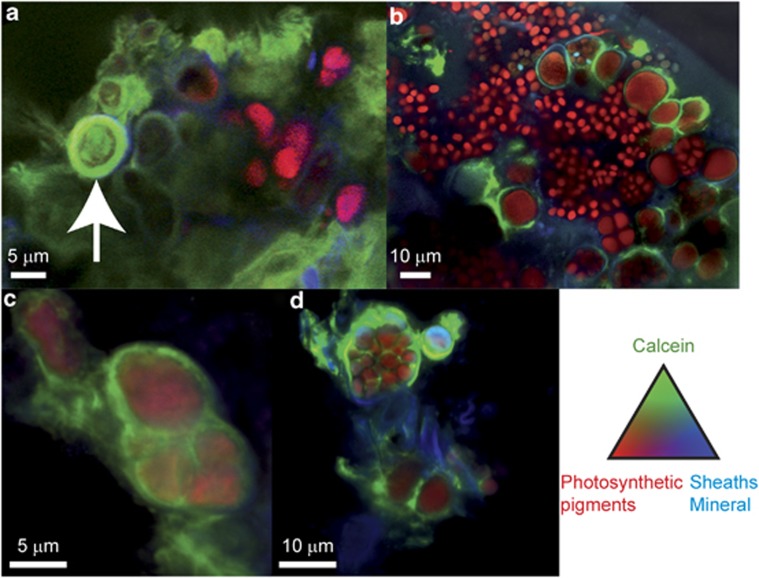
Figure 7.
Maximum intensity projection of stacked CLSM images obtained on RNAlater-fixed sample (a and c) or fresh sample (b and d) of microbialites from 14 m depth stained with calcein (not embedded). Images were obtained with a sequential excitation at 405, 488 and 543 nm, and fluorescence emission collected in the ranges 425–475, 500–530 and 560–660 nm. The white arrow indicates a cell strongly labeled by calcein.

