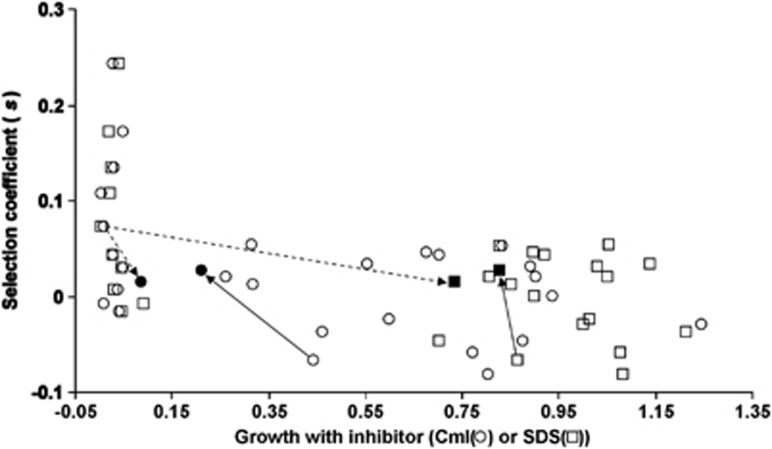
Figure 4.
The trade-off between fitness under nutrient limitation and resistance to antibacterial compounds. Selection coefficients were measured in chemostats fed with media containing 0.1 × M9+4% LSLB. Growth in the presence of 3 μg ml−1 Cml (circles) or 0.1% SDS (squares) were quantitated on spot plates as in Figure 3. The arrows link the altered positions in the trade-off of ECOR strains evolved as described in the text, from ECOR59 (dashed arrows) to ECOR59E (filled symbols) and ECOR5 (solid arrows) to ECOR5E (filled symbols).

