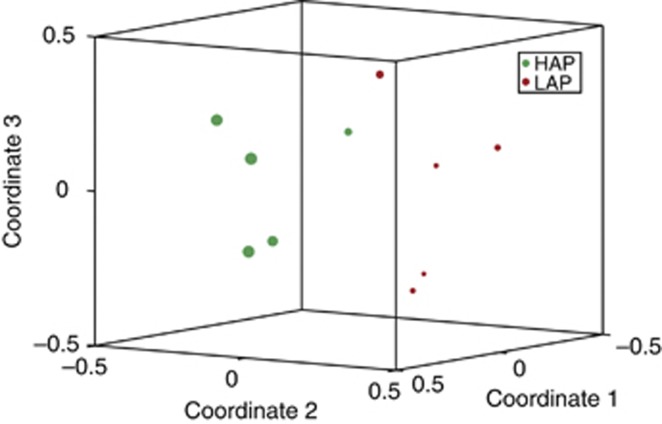
Figure 5.
Non-metric multidimensional scaling (NMDS) ordination of the community structures calculated with Bray–Curtis distances. Symbols representing the high-activity (green) and low-activity (red) samples are scaled to reflect the abundance of the significantly differentially represented OTU1 (q<1e—06), identified as a member of the family Chitinophagaceae. The differential abundance of OTU3 (q=0.014) is not shown; this OTU was somewhat more abundant in the low activity samples.

