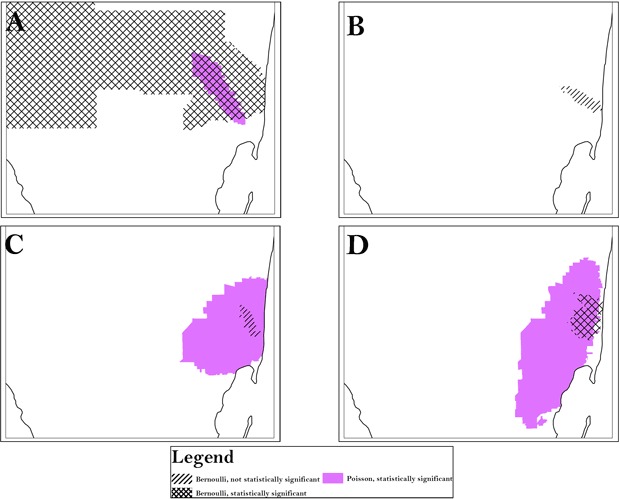
Figure 1.

Using census tract analysis as an example, the area of persistent clusters (Area A) is indicated for all race/ethnicities and was identified by both the Bernoulli and Poisson models. A, analysis of black population; B, analysis of Cuban population; C, analysis of Hispanic white population; D, analysis of non-Hispanic white population. To preserve confidentiality, maps are presented without points of reference.
