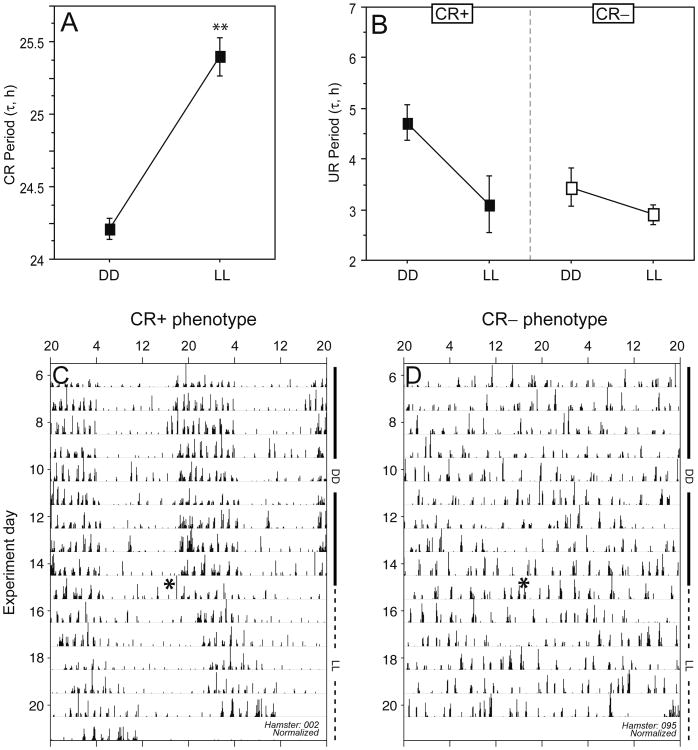
Figure 5.
Effects of constant light on circadian and ultradian rhythms. Mean ± SEM period of circadian (CR; panel A) and ultradian (UR; panel B) rhythms in circadian-rhythmic (CR+; n = 16) and circadian-arrhythmic (CR−; n = 12) hamsters that were housed in DD for 16 days and were then transferred to constant light. (C, D) Representative double-plotted activity records of a CR+ (C) and a CR− (D) hamster. Note free-running circadian activity (C) and circadian arrhythmicity (D) in both DD and LL. Intervals of exposure to DD and LL are indicated along the right ordinate. Clock time is at the top of each actogram. **p < 0.001 vs. DD value (within-group).

