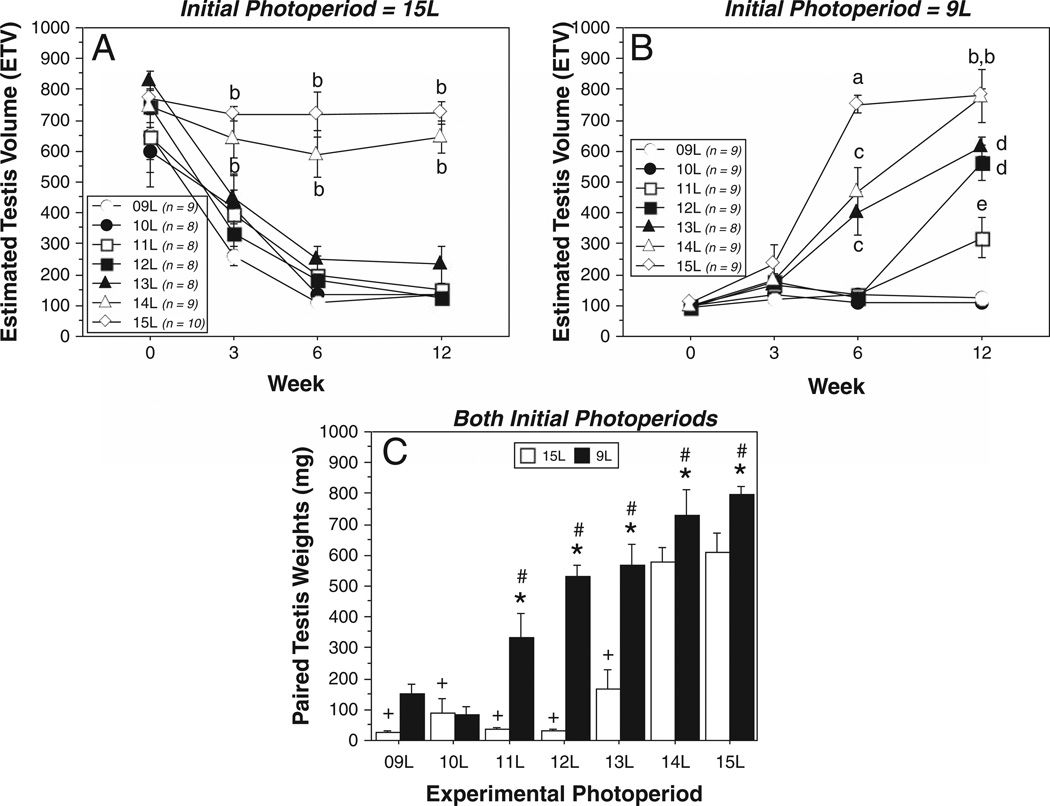
Figure 2.
Mean ± SEM estimated testis volumes (ETV) of male Siberian hamsters raised in (A) 15L or (B) 9L and transferred to 1 of 7 different experimental photoperiods. Final group sample sizes are indicated in the keys to panels A and B. Note nonlinearity of x-axis. (C) Mean + SEM paired testis weights at autopsy. In panels A and B: letters indicate p < 0.05 vs. aphotoperiods ≤14L, bphotoperiods ≤13L, cphotoperiods ≤12L, dphotoperiods ≤11L, ephotoperiods ≤10L. In panel C: *p < 0.05, 9L→ vs. 15L→ group, within experimental photoperiod. #p < 0.05 vs. 9L→9L value. +p < 0.05 vs. 15L→15L value.

