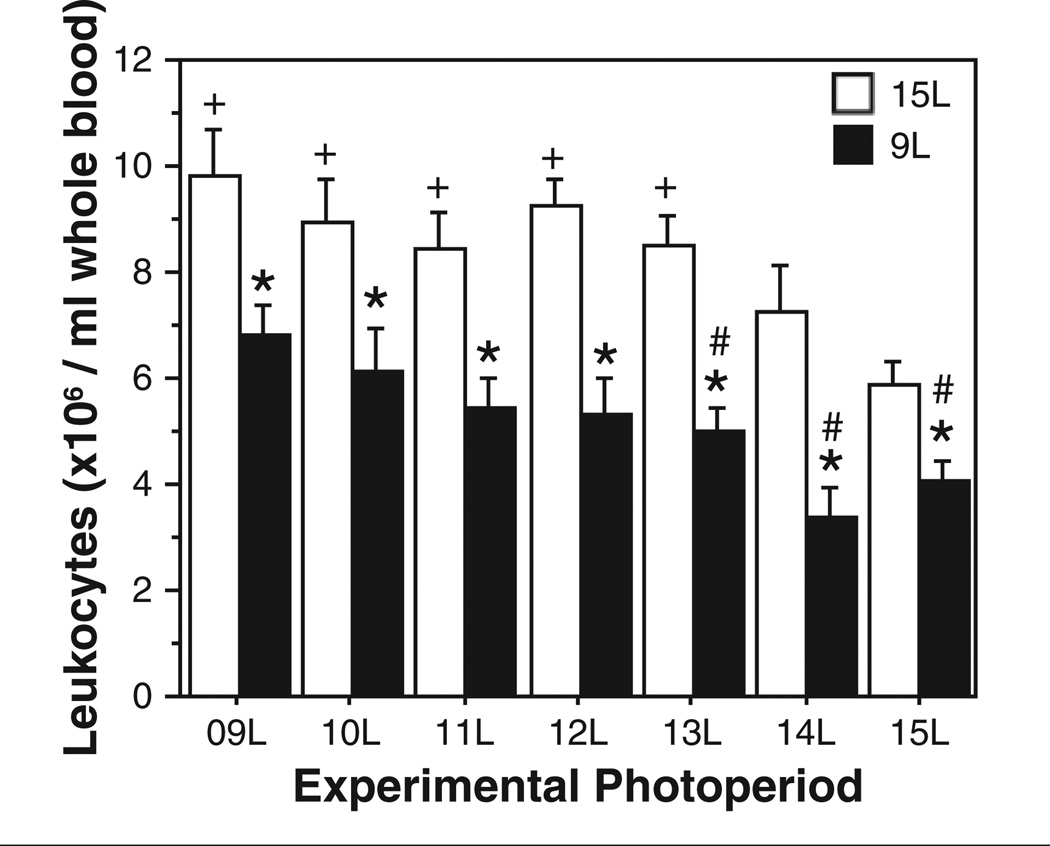
Figure 3.
Mean + SEM blood leukocyte concentrations of Siberian hamsters raised in 15L (open bars) or 9L (filled bars) following transfer to 1 of 7 different experimental photoperiods (indicated along the abscissa). *p < 0.05, 9L→ vs. 15L→ group, within experimental photoperiod. #p < 0.05 vs. 9L→9L value. +p < 0.05 vs. 15L→15L value.

