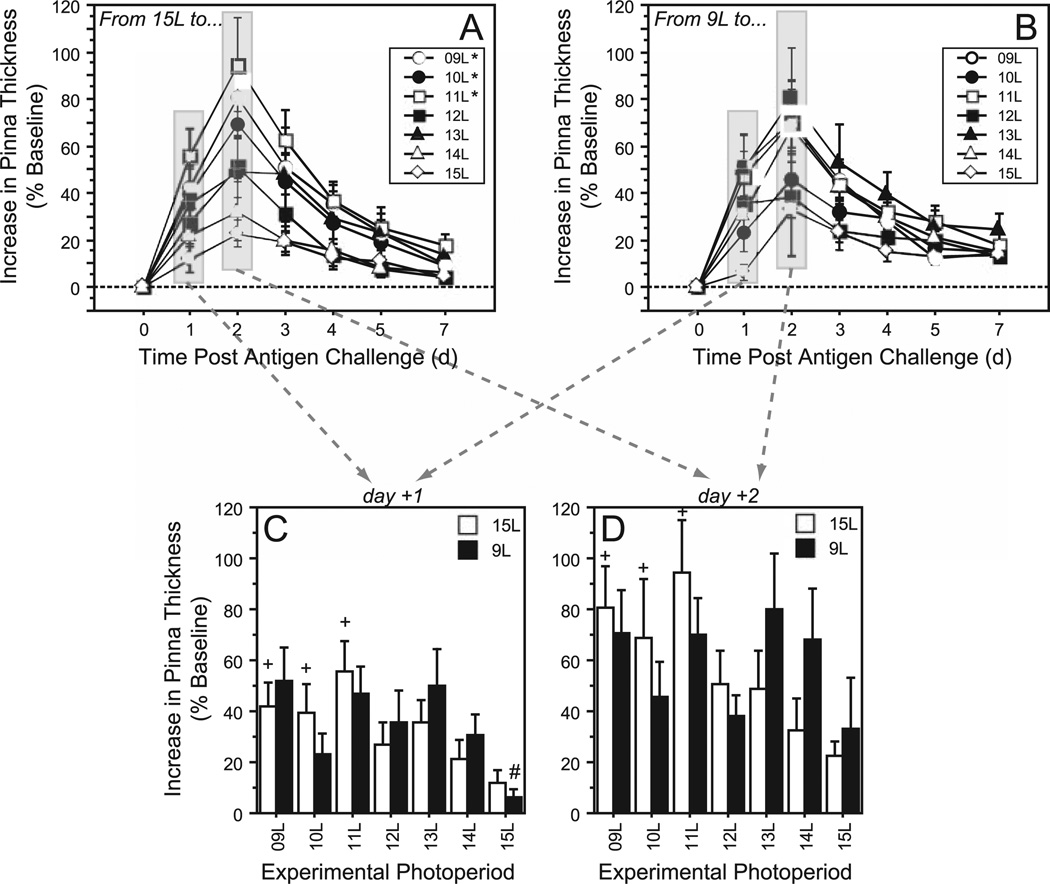
Figure 4.
Mean ± SEM delayed-type hypersensitivity (DTH) responses (percent increases in pinna thickness, compared to baseline) during the week after antigen (DNFB) challenge of Siberian hamsters raised in (A) 15L or (B) 9L and transferred to 1 of 7 different experimental photoperiods. Note nonlinearity of x-axis. Bar plots illustrate statistical comparisons of DTH magnitude (C) on the first day postchallenge (day +1) and (D) on the day of the peak DTH response (day +2) in each of the 7 experimental photoperiods (indicated along the abscissa). In panels A and B: *p < 0.05 vs. 15L→15L group (repeated-measures ANOVA). In panels C and D: #p < 0.05 vs. 9L→9L value. +p < 0.05 vs. 15L→15L value.

