
Figure 4. Expression of LRP1, RAGE and P-gp in bEnd3 and hCMEC/D3 cells.
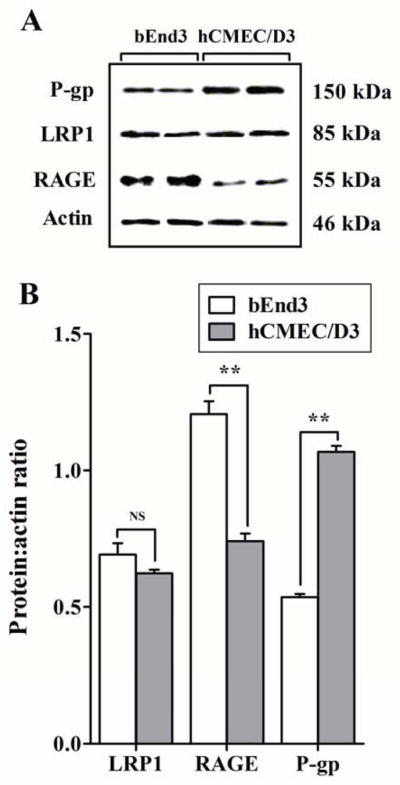
A) Western blot analysis of LRP1, RAGE and P-gp protein expression in bEnd3 and hCMEC/D3 cells. B) Densitometry analyses showed similar expression level of LRP1 in two cells, higher RAGE expression in bEnd3 cells and higher P-gp expression in hCMEC/D3 cells. Data represent mean±SEM from three independent experiments; ** P<0.01, NS is not significant.