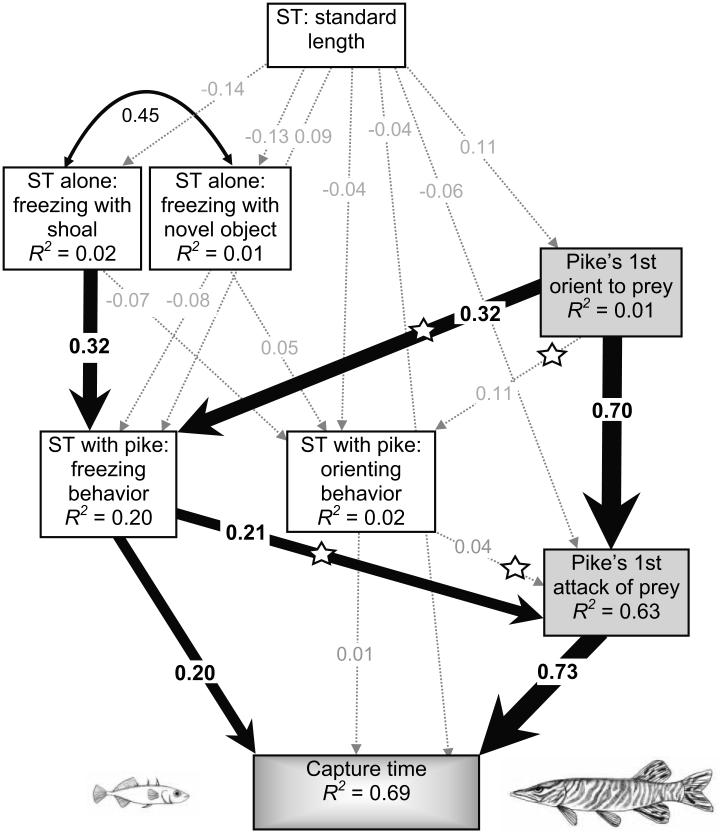
Figure 2.
Path diagram for the structural equation model with standardized regression weights for stickleback (ST) behavior (white boxes) and pike behavior (gray boxes). Statistically significant paths are indicated by solid arrows, and the strength of these relationships is indicated by the width of the arrows. Nonsignificant paths are indicated by gray dashed arrows. Straight arrows reflect causal paths; curved arrows designate correlations. The R2 values in each box indicate the amount of variation in that variable that is explained by the input arrows. Stars indicate the paths allowing behavioral feedback between predator and prey; N = 77 interactions. The standardized coefficients in these path diagrams are measured in standard deviation units.

