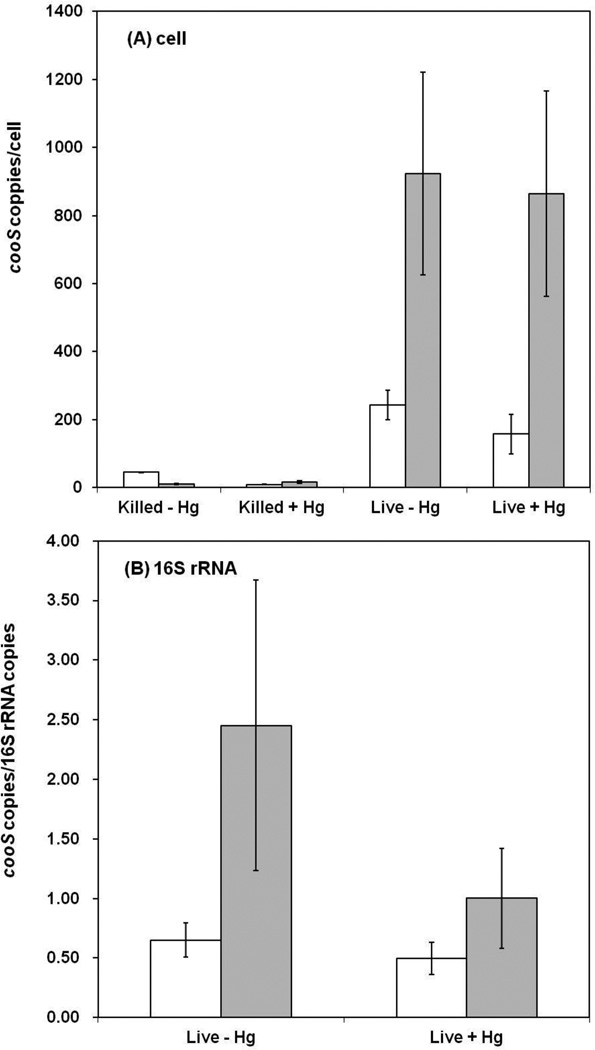
Figure 3.
Comparison of cooS gene expression, based on the 2−ΔΔCt method for relative quantification, between planktonic and biofilm cultures of D. desulfuricans ND132 in the presence and absence of Hg. (A) Copies per cell are relative values based on changes in the threshold cycle. (B) Copies of cooS per copies of 16S rRNA are also based on relative values based on changes in the threshold cycle. Blank columns represent planktonic cultures. Dark columns represent biofilm cultures. Error bars represent the standard error of triplicate experimental bottles (each bottle was subjected to triplicate analysis).

