
Figure 2. Overview.
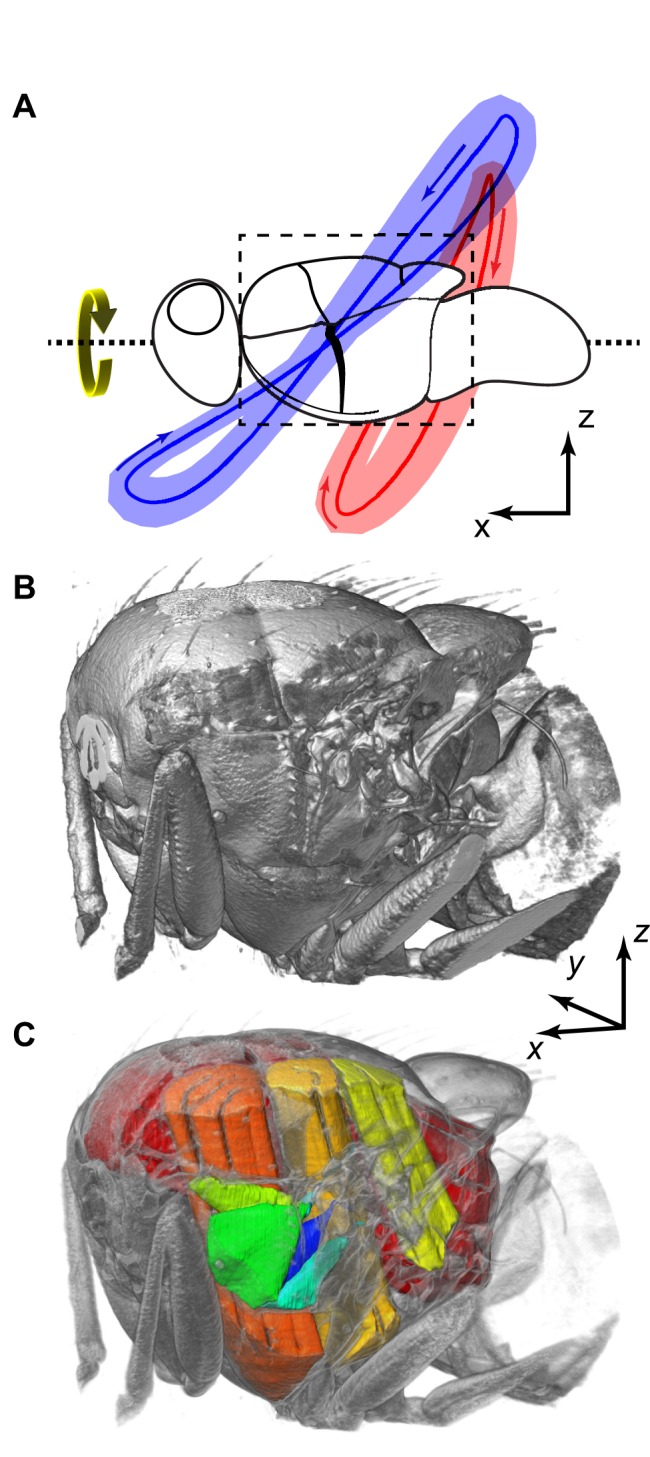
(A) Mean (red/blue lines) and standard deviation (red/blue shading) of wing tip position through all of the wingbeats of all four flies, showing differences in wing tip path between the left, high-amplitude (blue) and right, low-amplitude (red) wings. The arrows indicate the direction of the wings' movement. (B) External visualization of the thorax, covering the region outlined in (A). (C) Cutaway visualization of the thorax showing the five steering muscles analysed (green to blue) and the power muscles (yellow to red). Movie S1 provides an animated overview of the movements of these muscles (view Movie S1 here).