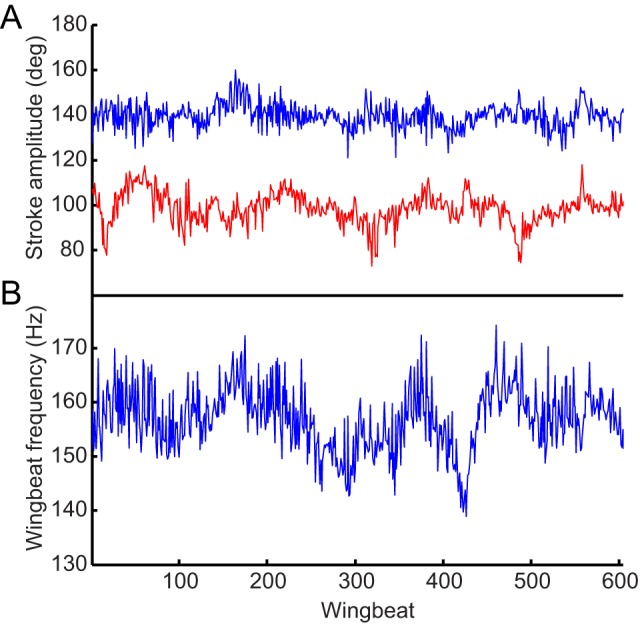
Figure 3. Wing kinematic parameters for one fly over entire recording period.

(A) Stroke amplitude for the left (blue) and right (red) wings. (B) Wingbeat frequency, calculated as the mean of both wings.

(A) Stroke amplitude for the left (blue) and right (red) wings. (B) Wingbeat frequency, calculated as the mean of both wings.