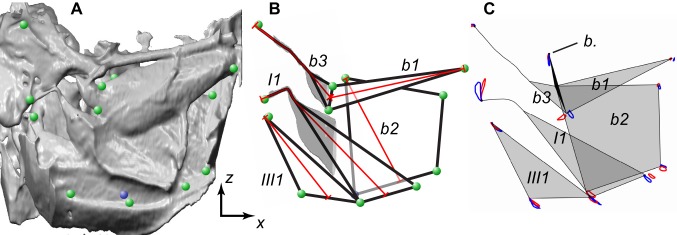
Figure 5. Measurements of muscle strains.

(A) Three-dimensional surface rendering showing the internal view of the left steering muscles (high-amplitude wing). The steering muscles are viewed from the inside of the thorax looking out toward the wing hinge. The green circles indicate the endpoints of the muscles that were tracked. The blue circle shows the ventral base of b2, which is hidden from view behind the I1 and III1 muscles. A clipping plane was used to remove these muscles so that the base of b2 was visible and could be tracked. (B) Schematic showing approximate shape of the five steering muscles (black lines) and the lines along which the muscle lengths were calculated (red lines). The grey shaded regions of I1 and b3 show where 3D skeletonization was used to find the centre line of the tendons to take buckling into account. (C) Diagram showing the movements of the endpoints of the steering muscles for the high-amplitude (blue orbits) and low-amplitude (red orbits) wings, averaged across flies. The view shown here corresponds to that in (C), with data for the other wing mirrored about the sagittal plane and overlain. The schematic representations of the muscles (shaded grey) and tendons (black lines) indicate the mean posture of the muscles at the start of the downstroke. b., basalare sclerite (filled black).
