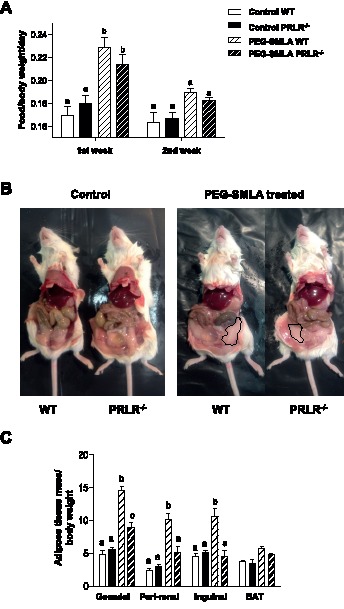
Figure 2. Effects of PEG-SMLA treatment on food intake and adipose tissues mass.

(A) Food consumption (g) is calculated reported to body weight of each mouse on first or second week of treatment. PEG-SMLA injections are represented within hatched bars. b, p<0.001 related to Control WT mice. (B) At the end of treatment, the intact abdominal fat depot (delimited lines) is shown on both genotypes. (C) Ratio of adipose depot mass per body weight. b, p<0.001 and c, p<0.01 related to Control WT mice. (n = 7–10/group).
