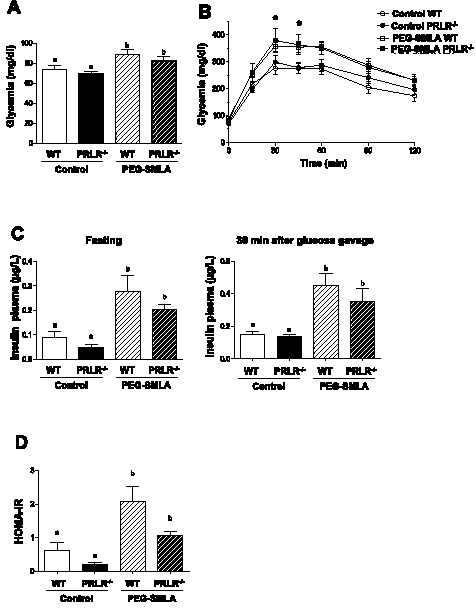
Figure 4. PEG-SMLA treatment induced glucose intolerance and insulin resistance on WT and PRLR−/− animals.

(A) Fasting glycemia in saline treated and PEG-SMLA treated mice. b, *p<0.05. (B) Oral glucose tolerance test (2g/kg) was performed in WT and PRLR−/− mice PEG-SMLA treated or not. (C) Fasting (left panel) and 30 minutes after glucose gavage (right panel) plasma insulin levels. (D) HOMA-IR index reflecting insulin resistance is calculated as follows: fasting plasma glucose (mg/dl) × fasting insulin (mU/L)/405.
