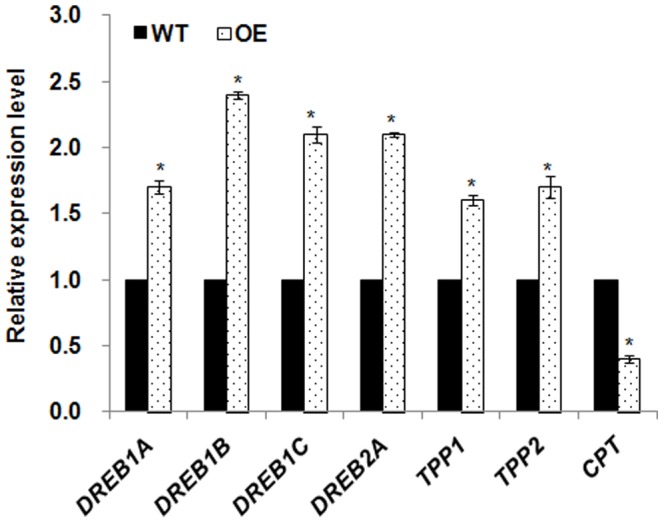
Figure 4. Expression levels of some cold-responsive genes in wild-type plants and overexpressing Osa-miR319b plants.

Marker gene expression levels were set equal to 1 in the WT plants in cold stress with 4°C for 8 h. The expression level of marker genes are represented as a ratio in OE plants compared with WT plants. Data are the mean ± SE of three biological replicates. Asterisks indicate statistically significant differences (*P<0.05) between WT and transgenic lines.
