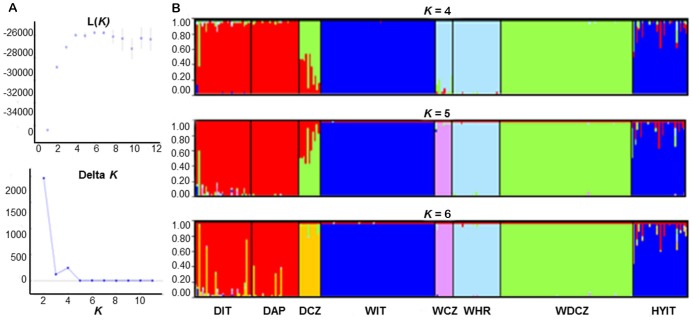
Figure 2. Structure analyses performed to infer the optimal partition of 8 sampled groups (A):
DIT = village dogs in Italy; DAP = Apennine dogs; DCZ = German Shepherd; WIT = wolves in Italy; WCZ = wolves in Czech and Slovak republics; WHR = wolves in Croatia; WDCZ = Czechoslovakian wolfdogs; HYIT = putative wolf x dog hybrids collected in Italy; (genotyped at 39 autosomal microsatellites). The posterior probability Ln(K) of the data and the statistics ΔK were used to identify the optimal K = 4 (averages of two independent runs). Plots of individual assignment probability to each inferred cluster are shown (B) for optimal K = 4, 5 and 6. Structure was run assuming K from 1 to 12, with 400,000 MCMC and discarding the first 40,000 burn-ins, using the “admixture” and independent allele frequency “I” models, and no prior information (option “usepopinfo” not activated).

