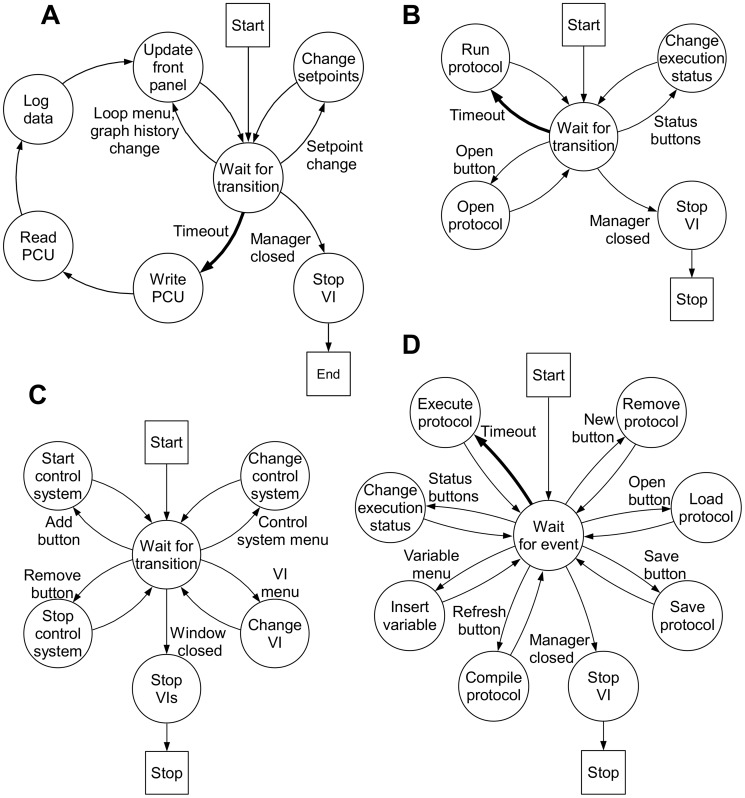
Figure 3. Logic Diagrams.
Visual representation of VI transitions and actions. Transitions and actions are represented by arrows and circles. The starting and ending states are represented by squares. Program execution flows from the start to end in the direction of the arrows. Transition timeouts, shown in bold, are the only transition that are not user prompted and occur after a period of time elapsed without transitions. 3A Bioreactor VI: Transition timeouts start a series of actions that writes bioreactor setpoints, reads bioreactor values and outputs, logs data, and updates the front panel. Loop name or graph history value changes update the front panel, while a setpoint value change updates the control loop setpoints. 3B Time Protocol VI: Execution status value changes alter the status to play, pause or stop. The play status allows execution of the loaded protocol. The pause status suspends protocol execution. The stop status restarts the protocol and suspends protocol execution. 3C Manager VI: An add/remove control system button value change starts/stops control systems. A control system menu value change modifies the control system VIs listed in the VI menu. A VI menu value change modifies the VI displayed in the subpanel. 3B Python Protocol A: new button value change clears the protocol path, protocol script and compiler output on the front panel. An open button value change prompts the user to select a protocol to load. The selected protocol text and path are placed in the protocol script and protocol path elements on the front panel. Bioreactor parameters used in protocol creation/modification are imported to the protocol script by selecting items from the variable menu.

