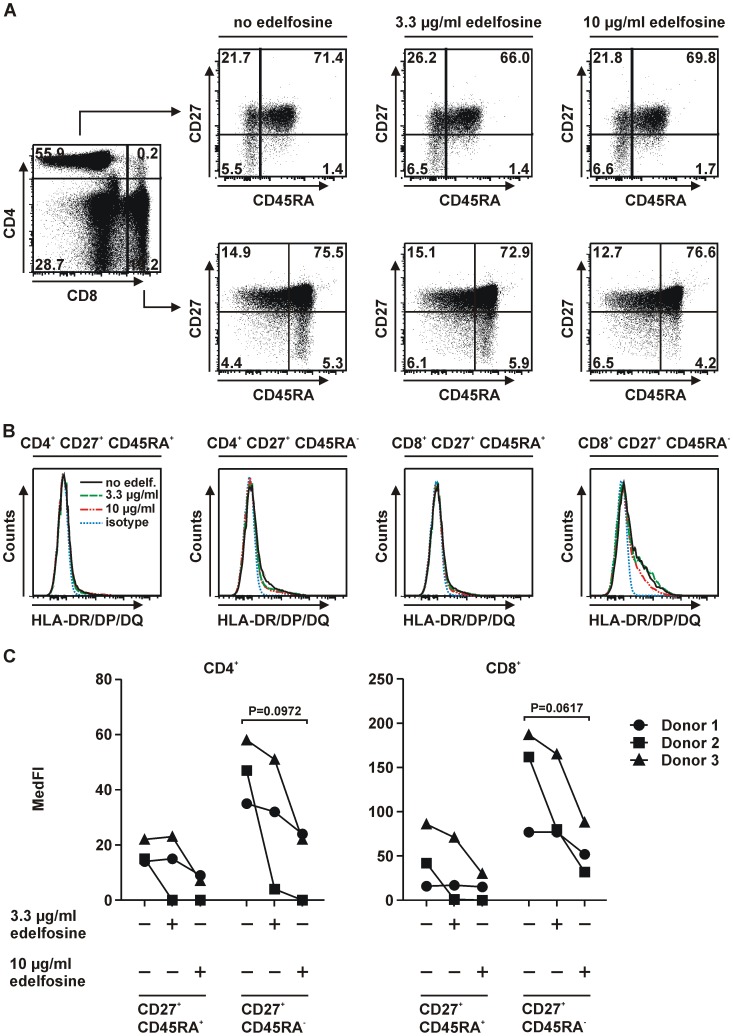
Figure 4. Edelfosine impact on HLA-DR/DP/DQ expression on human T cells.
(A) Gating strategy to identify viable CD4+ and CD8+ T cells and their naïve (CD27+CD45RA+) and memory (CD27+CD45RA−) subsets after the incubation of PBMCs for 24 h in the absence of edelfosine or in the presence of 3.3 µg/ml and 10 µg/ml edelfosine, respectively. (B) Representative histograms of one donor display the considerably low expression of HLA-DR/DP/DQ on the previously described T cell subsets. (C) Summary of MedFI values determined for each treatment within each T cell subset (n = 3 donors (represented by symbols •, ▪, ▴), + edelfosine added as indicated, − no edelfosine added). For CD27+CD45RA+ and CD27+CD45RA− populations of CD4+ and CD8+ T cells no significant reduction of HLA-DR/DP/DQ expression was observed after Bonferroni post-hoc analysis (depicted P-value: as determined by repeated measures ANOVA). Histogram legends for B: no edelfosine (black line), 3.3 µg/ml edelfosine (green line), 10 µg/ml edelfosine (red line), isotype control (blue line).

