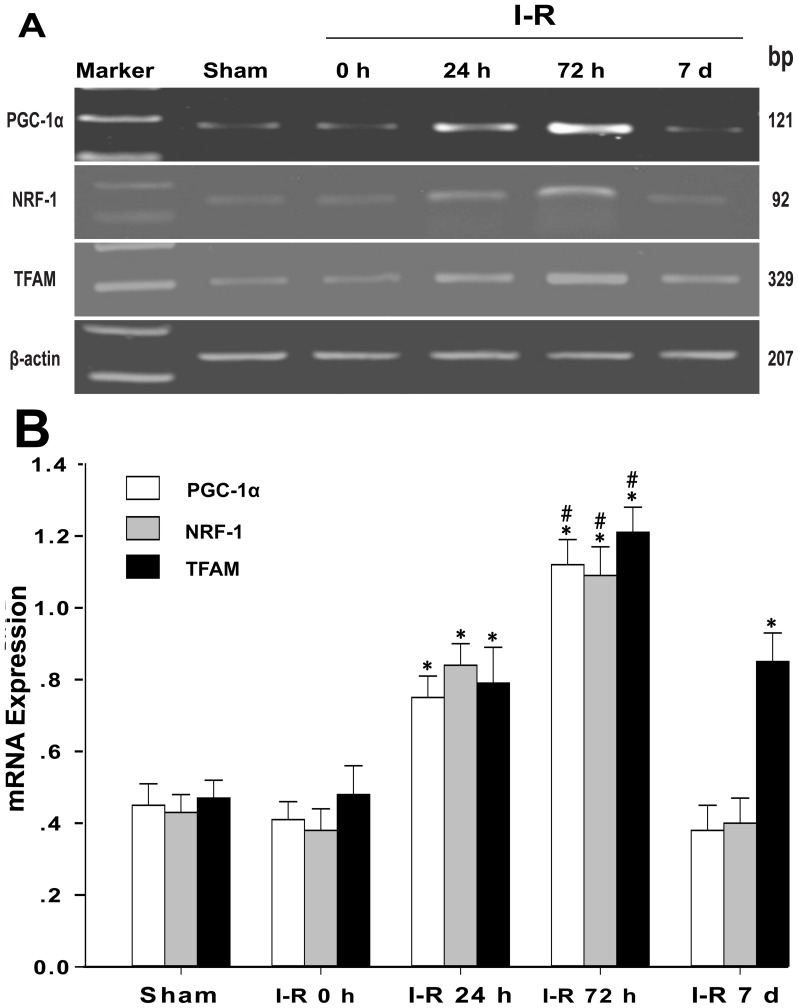
Figure 3. mRNA expression of the mitochondrial biogenesis factors in the cortex.
(A) Representative agarose gel of PGC-1α, NRF-1, and TFAM RT-PCR products prepared from the mRNA of the sham group or the I-R 0 h, I-R 24 h, I-R 72 h, and I-R 7 d groups. (B) The histogram shows the semi-quantitative measurement of the PCR products in (A), which were obtained using densitometric analysis. The data are expressed as the means±SD. *P<0.05 versus the I-R 0 h and sham groups; #P<0.05 versus the I-R 24 h and I-R 7 d groups.

