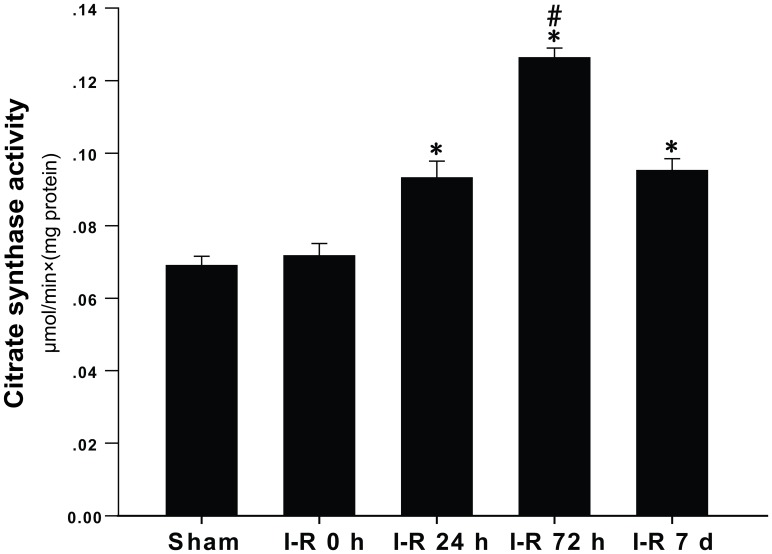
Figure 5. Changes in the citrate synthase activity.
The citrate synthase activity was expressed as (μmols of substrate transformed)×min−1×(mg protein)−1 of citrate synthase. The data are expressed as the means±SD. *P<0.05 versus the I-R 0 h and sham groups; #P<0.05 versus the I-R 24 h and I-R 7 d groups.

