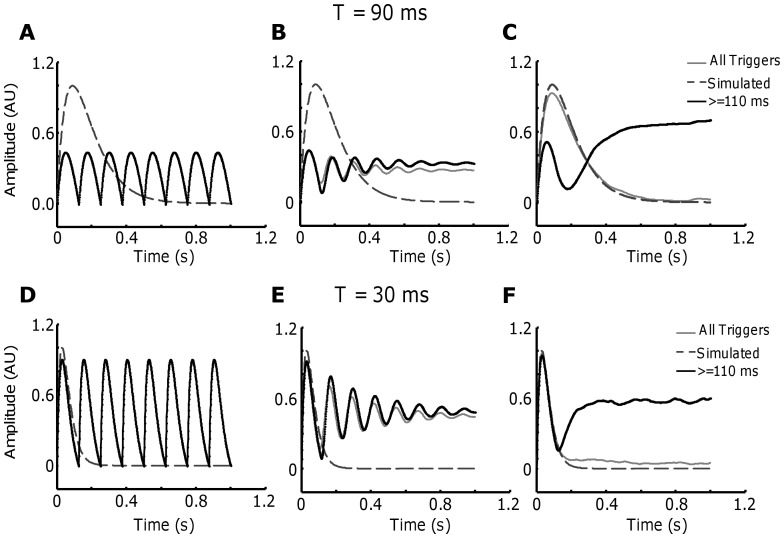
Figure 6. Effect of the selection of the triggers.
The twitch waveform has P = 1 and the discharge rate was selected to 8 pps as before. A. Original twitch waveform (blue) with T = 90 ms and estimated twitch with the original (grey) and modified (black) method. B. Similar with CoV for ISI of 15% and ∼80% (C). The estimation for the case with T = 30 ms are reported on the bottom (D, E and F).

