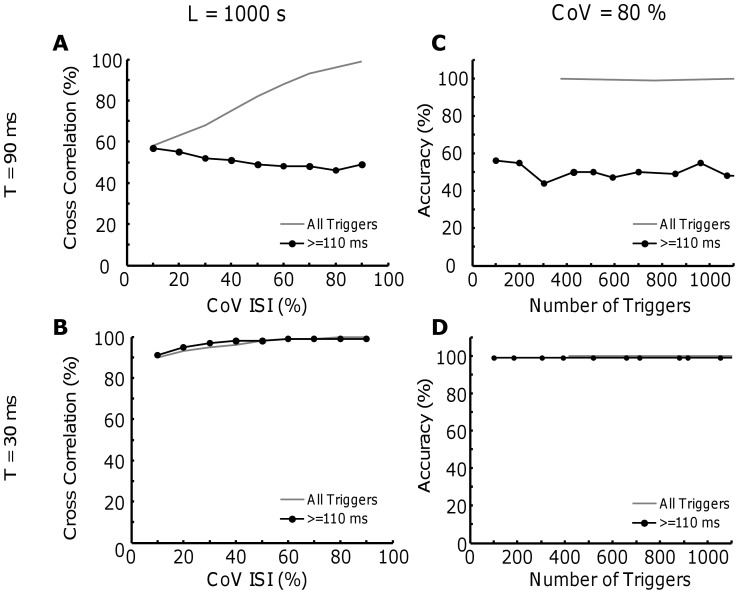
Figure 7. Conseguence of variability and total number of triggers for the estimation of motor unit twitch performed with the original or modified version of the STA technique.
A. The cross correlation between the original twitch waveform (P = 1 and T = 90 ms) and the estimation performed with the standard STA technique (black line) or the modified one (pointed line) when the CoV is varied between 10 and ∼80%. B. similar results for T = 30 ms. C. In this case, the CoV for ISI is maintained very high (∼80%), but the number of triggers is increased (T = 90 ms). D. Similar results for the case with T = 30 ms.

