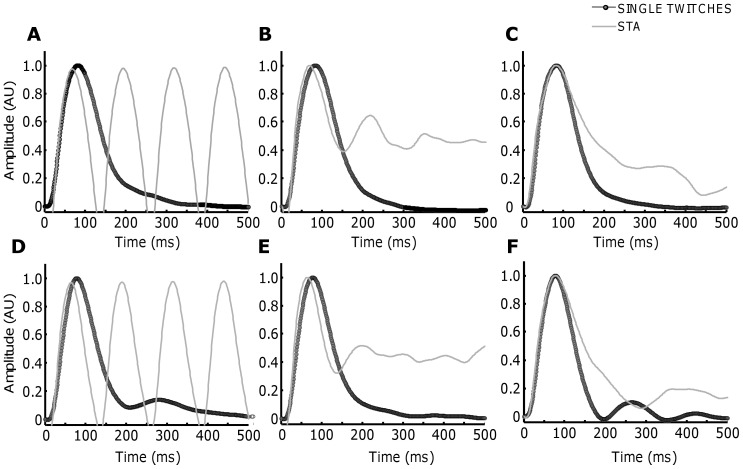
Figure 8. Experimental results performed with stimulation of the FDI muscle subject one (A,B and C) and subject two (D, E and F).
Similar as the simulations results, the discharge rate was fixed at 8(black lines). A. Periodic discharge pattern. B. CoV of ∼30%. C. CoV of ∼80%. Similar results are reported for the second subject (D, E and F).

