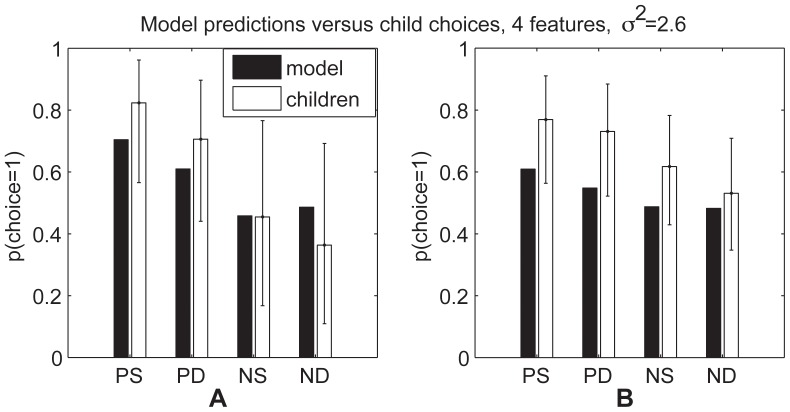
Figure 2. Model predictions for data in Experiment 1 of Fawcett and Markson [1].
(A) Results for children who showed a preference for 4 interesting toys. (B) Results for children who only showed a preference for 3 of 4 toys. The first character for each pair of bars denotes whether the actors showed a positive (P) reaction to the hidden toys versus a negative (N) reaction. The second character reflects whether the hidden object was said to be in a similar (S) or different (D) category from those seen in training.  is the probability of selecting Actor 1's novel object. Error bars represent 95 percent confidence intervals. Cases where children had fewer than 4 chances to play with the training objects are excluded. For (A), there were 17, 17, 11 and 11 participants in the PS, PD, NS, and ND groups, respectively. For (B), there were 26, 26, 32, and 32 participants in the PS, PD, NS, and ND groups, respectively.

