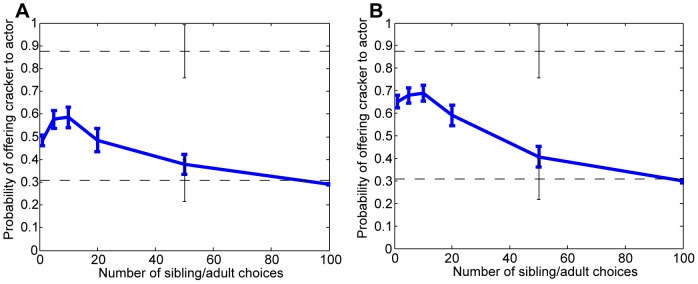
Figure 3. Results of simulations of the unmatched condition from Repacholi and Gopnik [3].

Each line shows the mean across 15 simulations, with standard errors. In both plots, the upper dashed line marks the proportion of 14-month-olds who offered the actor goldfish over broccoli (7 of 8), while the lower dashed line marks the proportion of 18-month-olds who did so (8 of 26), with standard errors. Plot (a) assumes equal prior belief in each model, while (b) assumes that the simpler model has a prior probability of 0.9.
