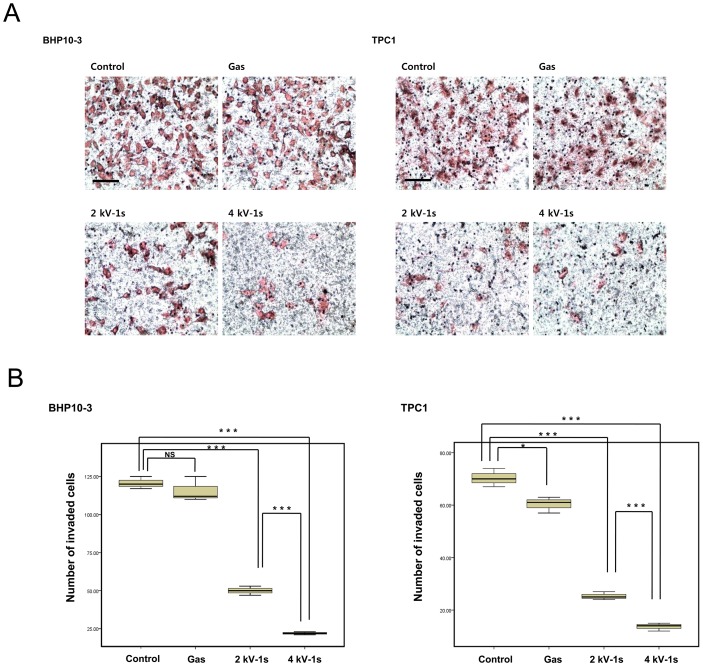
Figure 6. Invasion assays.
(A) BHP10-3 and TPC1 cells were seeded on filters (pore size, 8 µm) coated with Matrigel in the upper compartment and exposed to He+O2 gas only, 2 or 4 kV of NTP for 1 s. After 24 h, the cells in the pores or cells attached to undersurface of the membrane were counted, and those cells attached to the lower section were stained with H&E and counted using light microscopy (200×). Scale bar = 100 µm. (B) Quantification of the invasion assay data. NTP treatment significantly reduced the number of BHP10-3 (P<0.001) and TPC1 (P<0.001) cells that penetrated the membrane. The data represent the mean ± S.D. of three independent experiments. *P<0.05, **P<0.01, ***P<0.001.

