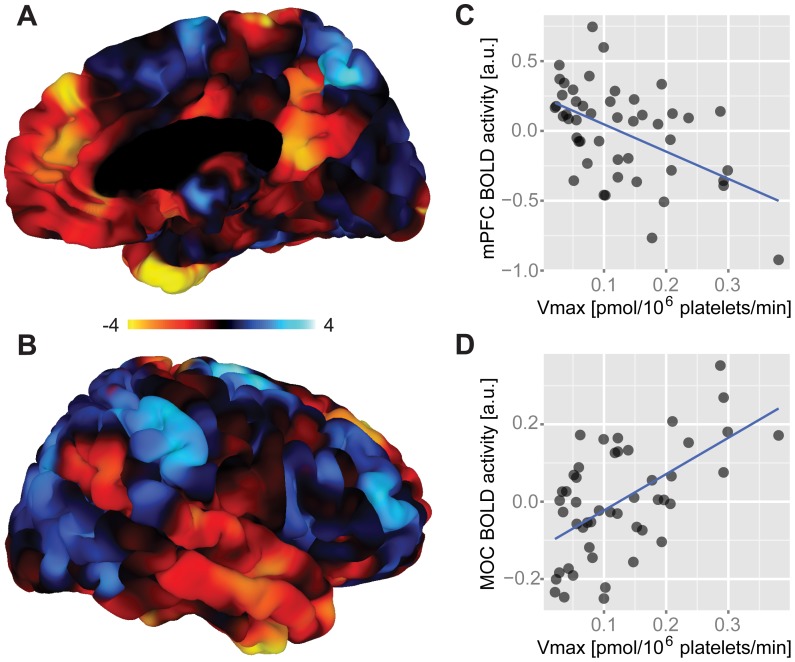
Figure 1. Functional brain correlates of platelet 5-HT uptake velocity.
(A–B) Figures display right-hemispheric surface mappings of a whole-brain correlation analysis between platelet Vmax and BOLD activity (n = 48). Significant brain areas showed positive and negative correlations. Negatively correlated clusters comprised areas of the DMN such as regions within the mPFC/ACC as well as the PCC, MTG, and ITG. Positive correlations were found in the fronto-parietal control system encompassing the CEN and SN with a significant cluster located in the right MOC and PMC. The corresponding left-hemispheric mapping is shown in Figure S2. Colorbar represents t-values. (C) Scatter plot shows the negative relationship between platelet Vmax and BOLD activity averaged across the mPFC cluster (peak at [−7.7, 44.1, 27.5]). (D) Scatter plot shows the positive relationship between platelet Vmax and BOLD activity averaged across the MOC cluster (peak at [20.8, −21.6, 69.1]). All analyses are controlled for age, gender and 5-HTTLPR. Serotonin, 5-HT; maximal 5-HT uptake velocity, Vmax; default mode network, DMN; medial prefrontal cortex, mPFC; anterior cingulate cortex, ACC; posterior cingulate cortex, PCC; middle temporal gyrus, MTG; inferior temporal gyrus, ITG; central executive network, CEN; salience network, SN; motor cortex, MOC; premotor cortex, PMC; blood-oxygen-level dependent, BOLD; a.u., arbitrary units.

