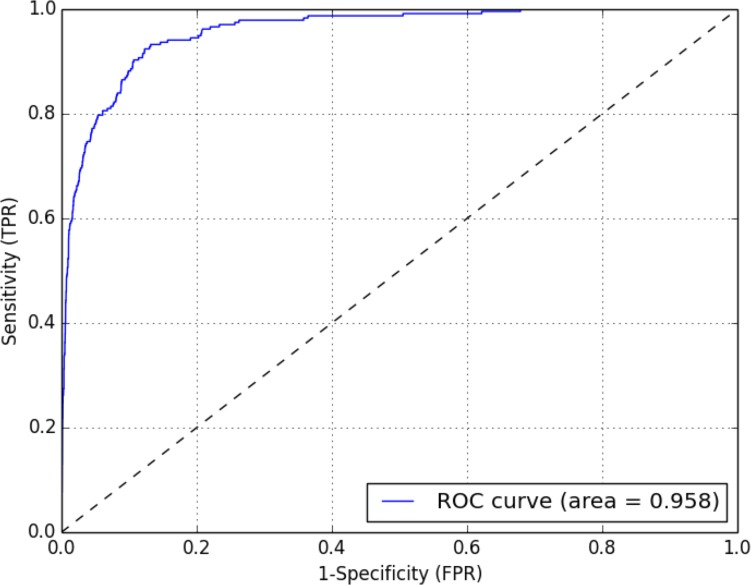
Figure 3. Cosine similarity Receiver Operating Characteristic (ROC) curve.
ROC curve showing the sensitivity (True Positive Rate, TPR) vs. 1- Specificity (False Positive Rate, FPR) when measuring cosine similarity of the expanded SMQ built from the existing SMQ and augmented with the terms identified as being significantly correlated with the outcome based on contingency tables. Statistics were computed using the R pROC package [41].

