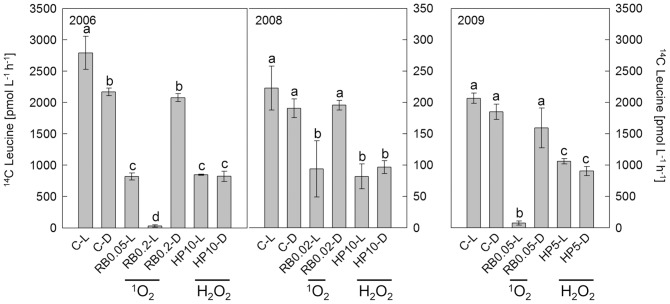
Figure 3. Activity of heterotrophic microorganisms after 1O2 and H2O2 exposure.
Microbial activity was measured as leucine incorporation during 1(with p≤0.001) between values as determined by one-way ANOVA followed by pair-wise multiple comparison analysis with the Tukey’s test performed in Sigma Stat v. 2.0 (Systat Software). The same letters indicate that depicted values are not significantly different to each other. Tests were done separately for each year. Abbreviations are given in Fig. 1.

